Fig. 3.
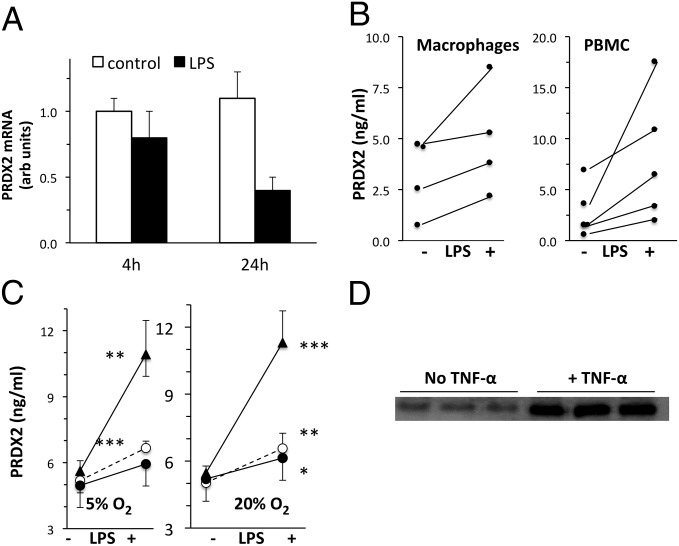
PRDX2 release in different experimental conditions. (A) PRDX2 mRNA in RAW264 cells at 4 h or 24 h after stimulation with 100 ng/mL LPS. PRDX2 mRNA expressed in arbitrary units (normalized to GAPDH as described in Materials and Methods), representing the fold change relative to one of the control samples at 4 h. Results are the mean ± SD of triplicate samples analyzed in duplicate. (B) Release of PRDX2 by human macrophages (Left) or PBMCs stimulated with 100 ng/mL LPS for 24 h. PRDX2 was measured by ELISA in triplicate samples of macrophages from four donors or PBMCs from five donors. Mean ± SD values for macrophages were control, 3.22 ± 1.92 ng/mL and LPS, 4.97 ± 2.69 ng/mL. Mean ± SD values for PBMCs were control, 2.90 ± 2.54 ng/mL and LPS, 8.10 ± 6.31 ng/mL. Increases were statistically significant for both macrophages and PBMCs (P < 0.05, t test for paired data). (C) Release of PRDX2 by PBMCs at physiological oxygen concentration. PBMCs were stimulated with 100 ng/mL LPS for 24 h under physiological (5%; Left) or atmospheric (20%; Right) oxygen levels. PRDX2 was measured by ELISA in triplicate PBMC samples from three donors. *P < 0.05; **P < 0.01; ***P < 0.001 vs. respective control (without LPS), Student t test. (D) PRDX2 released by HEK 293T cells stimulated with 50 ng/mL TNF-α for 24 h. Each lane represents an independent biological sample.

