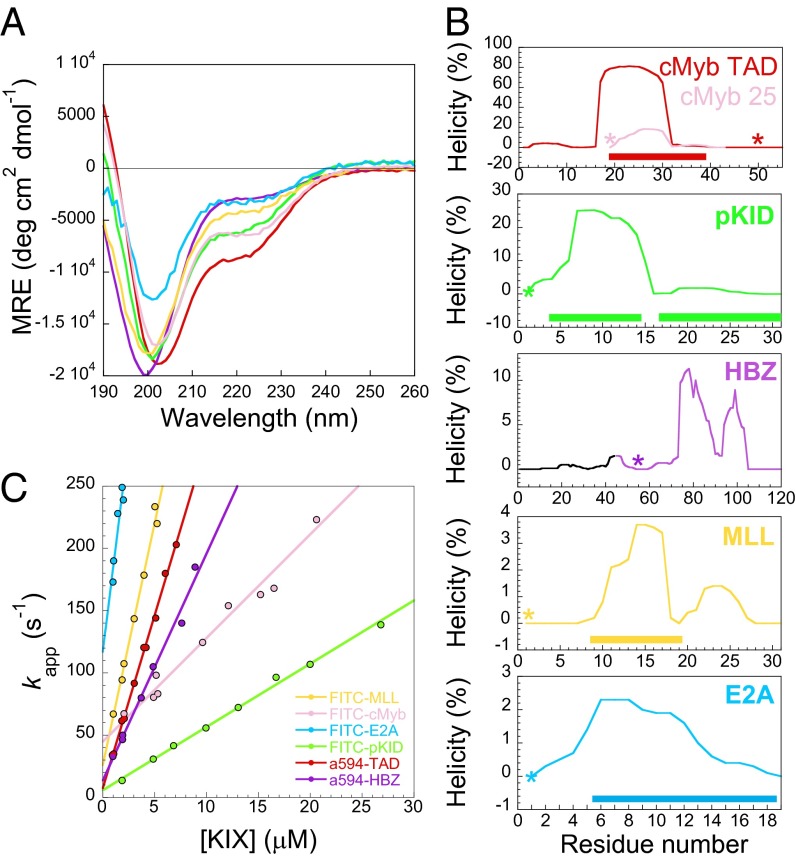
Fig. 2.
Secondary structural properties and association kinetics for various KIX binding partners. (A) CD spectra indicate a range of helical contents. Data are plotted as Mean Residual Ellipticity (MRE), and are the average of three independent experiments. (B) AGADIR predictions of helicity. Solid rectangles indicate residues in helix within the complex. Note the different scales on the y axes. *Position of fluorophores in labeled peptides. (C) Association rates with KIX under pseudofirst-order conditions (with KIX in excess). Data for FITC-cMyb obtained from Shammas et al. (22).

