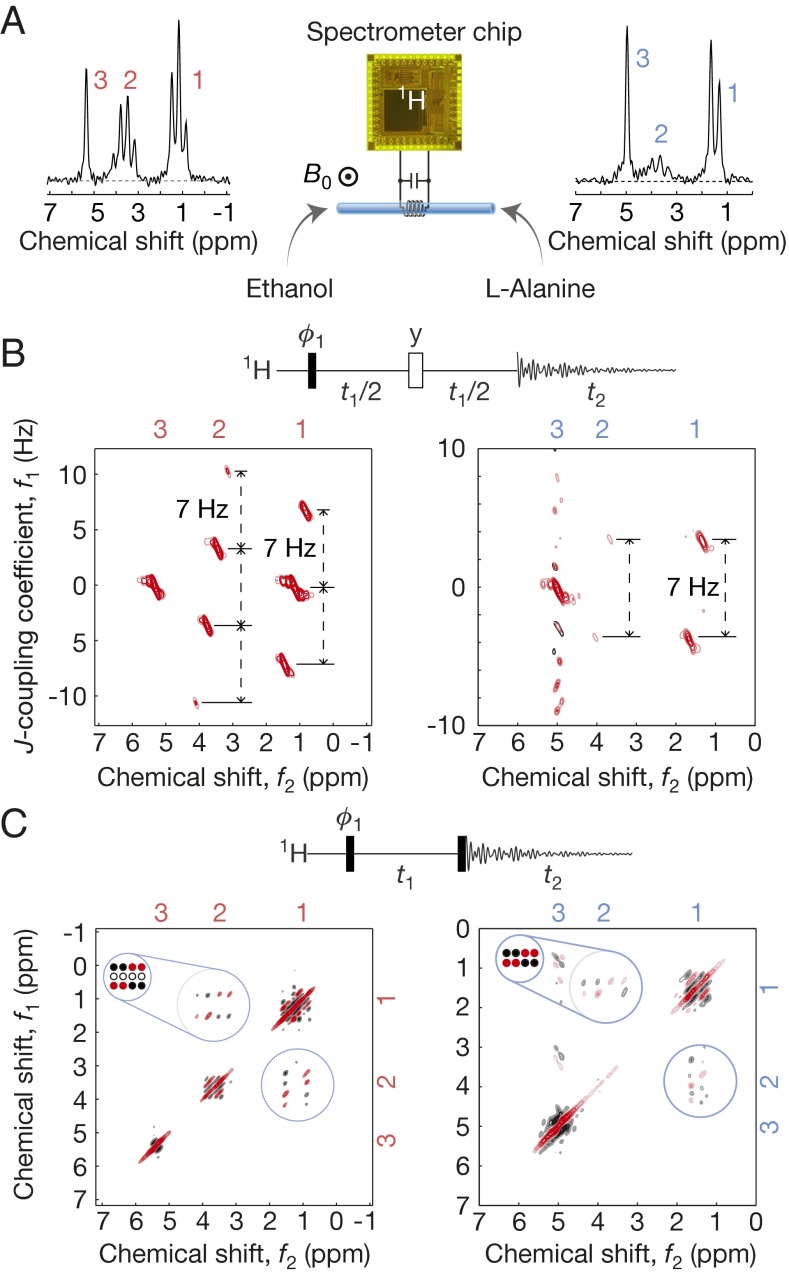
Fig. 4.
Two-dimensional 1H NMR spectroscopy. (A) Setup; 1D spectra of ethanol and l-alanine, identical to Fig. 3 C and D. (B) J-resolved spectra of ethanol (Left) and l-alanine (Right); each takes 15 min to obtain (84 scans with a single scan/wait time of 11 s). In the pulse sequence, black (white) bar signifies a π/2 (π) pulse. Quadrature detection in the f1 domain is done by additional phase cycle with ϕ1 shifted by π/2 (41). (C) COSY spectra of ethanol (Left) and l-alanine (Right); each takes 73 min to acquire (400 scans with a single scan/wait time of 11 s).

