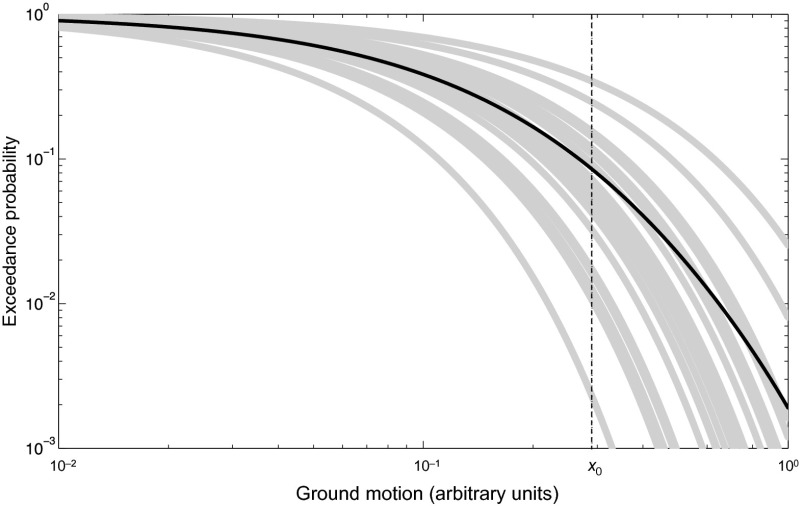
Fig. 1.
A simple PSHA model used in our testing examples. Gray lines show the experts’ ensemble of 20 exponential hazard curves {Fm(x): m = 1, …, 20}. Black line is the corresponding mean hazard curve . The distribution of values sampled at x0 (dashed line) is given in Fig. 2.

