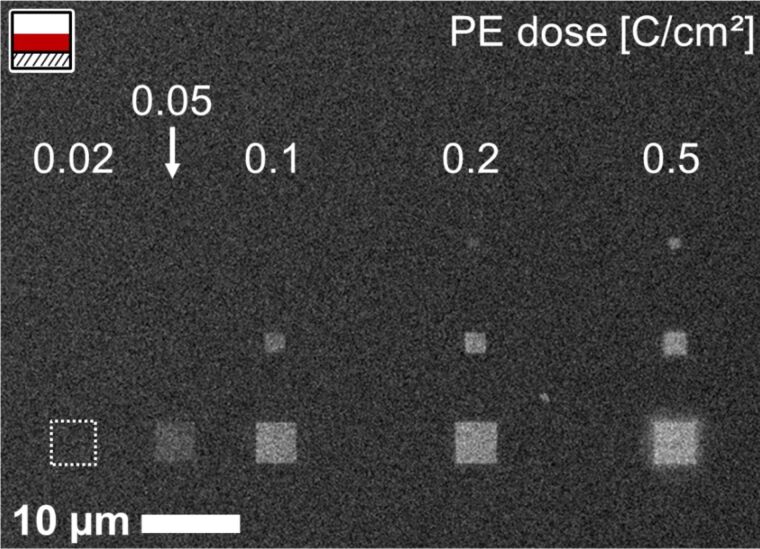
Figure 2.
SEM micrograph of square EBID structures of different sizes and primary electron doses (as indicated), prepared on a 100 nm Si3N4 membrane using Co(CO)3NO. The structures were prepared in one experimental run, from left to right, top to bottom. After the EBID step, the precursor was further supplied to allow for autocatalytic growth. The total growth time increases from 198 min (bottom right structure) to 230 min (top left structure). The minimum electron dose for detectable deposition is about 0.05 C/cm2, while a dose of 0.5 C/cm2 marks the start of proximity effect-induced loss of structure definition (fringe surrounding bottom right structure).

