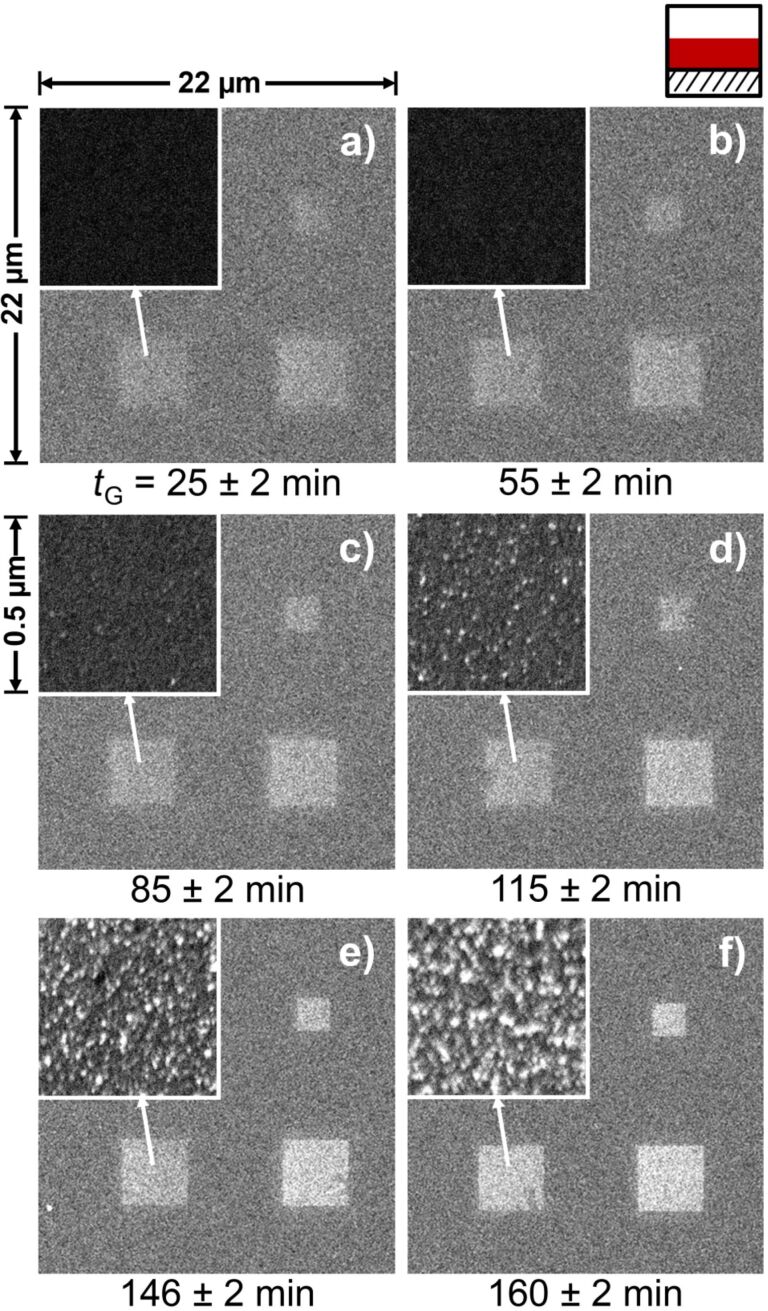
Figure 3.
Nanostructures prepared by EBID plus autocatalytic growth using Co(CO)3NO on Si3N4 with different growth times, as indicated below the images. The electron dose during EBID was 0.2 C/cm2 for the structures in the right column of every image; the dose of the lower left square was 0.1 C/cm2. The insets show higher magnification images of the respective structures directly below. With increasing growth time the images appear brighter, and the granular nature of the deposits is more pronounced.

