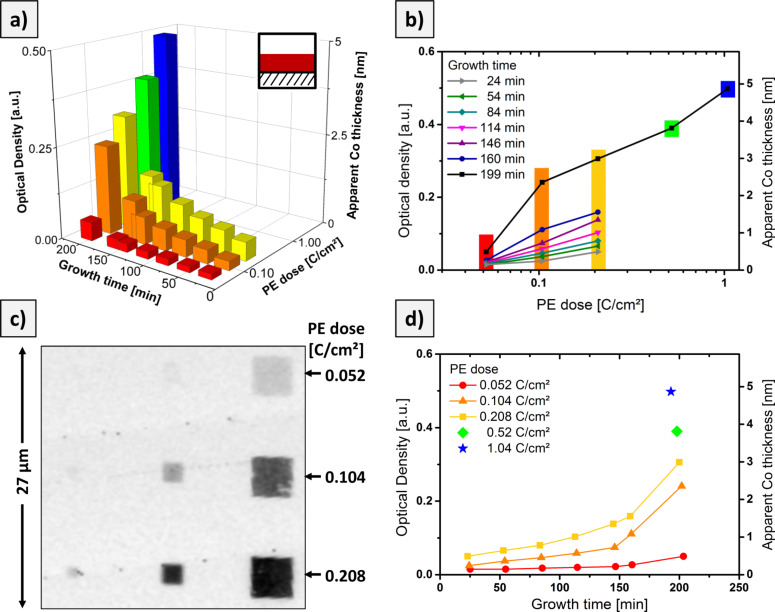
Figure 5.
Evaluation of the X-ray absorption data for the growth of Co-containing deposits by EBID plus autocatalytic growth upon Co(CO)3NO dosage. a) Optical density (left vertical axis) and apparent Co thickness (right vertical axis) of 4 × 4 µm2 squares vs growth time and PE dose during EBID. b) and d) detailed graphs of the observed growth behavior; the color code identifies the respective data set. c) STXM micrograph (transmitted intensity) of a set of deposits prepared with different PE doses, but the same growth time of about 160 min obtained at a photon energy of 780.4 eV. See text for the definition of the apparent Co thickness.

