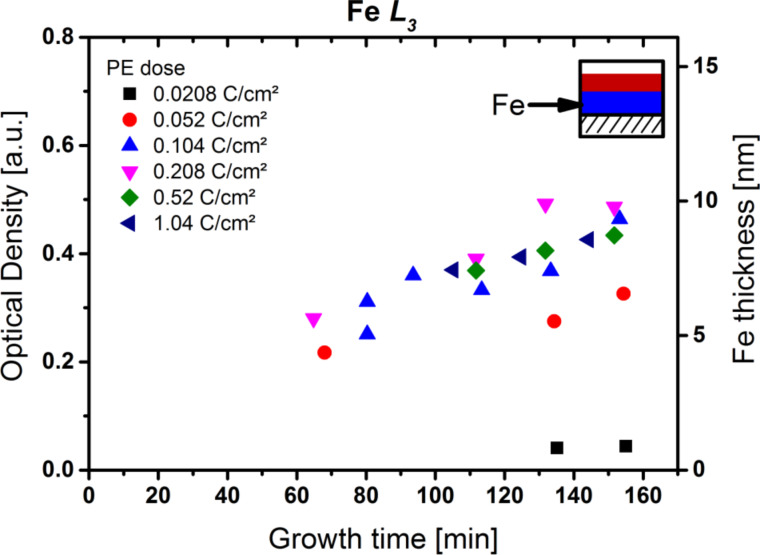
Figure 6.
Optical density at the Fe L3 edge at 708.7 eV (left vertical axis) and average thickness of the iron layer (right vertical axis) of various CoOxNyCz/Fe nanostructures versus autocatalytic growth time for Fe(CO)5. The different symbols indicate different primary electron (PE) doses. Above 0.05 C/cm2, the thickness/optical density increases linearly with the growth time at a rate of 0.5 ± 0.1 Å/min irrespective of the applied PE dose. Lower PE doses (red, black) exhibit reduced thickness.

