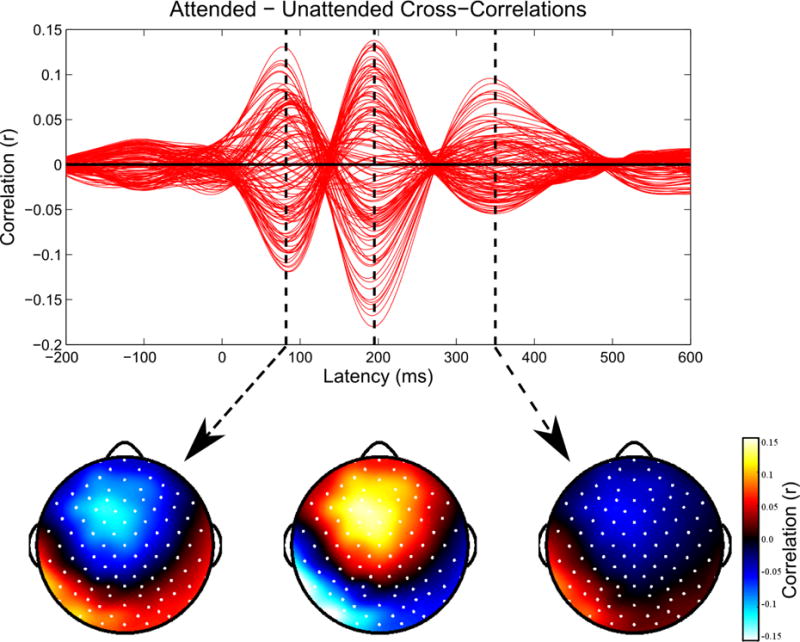
Figure 3. Cross-Correlations: Identifying Channels and Latencies of Interest.

For each subject, we calculate the average cross-correlation functions for the attended and unattended stimuli in the training data, and then plot their difference to identify channels and latencies where they are most distinct. Red lines indicate individual channels. Within the 15 channels with the largest magnitude differences between the attended and unattended cross-correlation functions, we find the three largest peaks in the difference function. Data shown for one representative subject.
