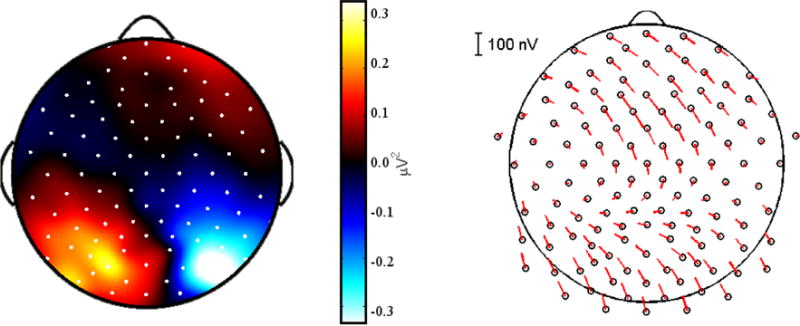
Figure 4. Alpha Lateralization and ASSRs.

Left: A topographic plot for a representative subject showing the difference in alpha (8–12 Hz) power between all “Attend Left” trials and “Attend Right” trials in the training set. A lateralization in alpha power is visible, with maximal differences measured in parietal electrodes. Right: The average ASSRs for a representative subject. Magnitude is indicated by the length of the line extending from each electrode, while the phase is indicated by the angle. ASSR topography was typical for EEG studies, with peaks in magnitude over frontal and occipital electrodes.
