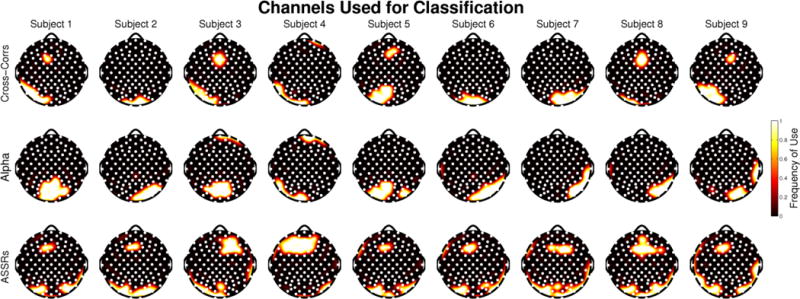
Figure 5. Selected Channels.

Topographies depicting the most informative channels for each subject and each feature. Frequency of use for each channel ranges from 1, meaning it was selected as one of the 15 most informative in every single train/test iteration, to 0, meaning that the channel never was selected as one of the most informative 15 channels.
