
Figure 7. Cross-Subject Classification Results.
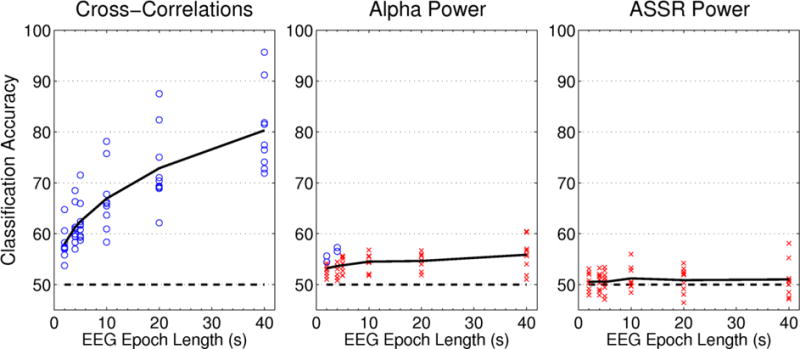
Classification accuracy is plotted as a function of EEG sample length for each of the three features extracted from the EEG. Each point represents the mean classification accuracy for a single subject, while the solid black line indicates the average across all nine subjects. Chance is marked with the dashed line at 50% classification accuracy. Significantly above-chance accuracy values are marked by circles, while non-significant values are indicated by crosses.