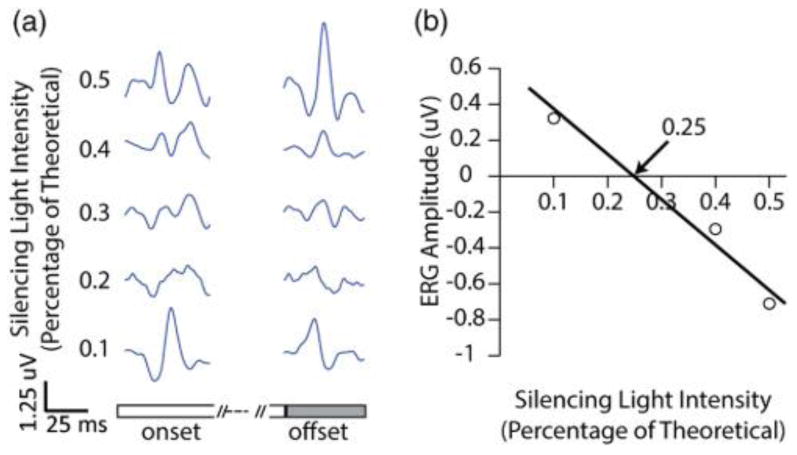
Fig. 1.

This figure shows how the S-cone ERG settings were systematically adjusted from the theoretically calculated S-isolation point by using the +(L+M) signal contamination. (a) Shows ERG traces with different percentages of long wavelength silencing lights. A value of 1 corresponds to perfect isolation with no estimate for the yellowing of the lens. The top two traces (0.5 and 0.4) contain L/M-contamination at light offset, which indicates the silencing lights are still too bright. The next two traces (0.3 and 0.2) are noisy for the relatively small amount of averages, and the true S-cone ERG is in one or both of those traces; therefore they are not used in the fit. The bottom trace (0.1) contains obvious +(L+M)-contamination at light onset, which indicates the long wavelength silencing lights are too dim. (b) Shows the plots from the +(L+M) b-wave amplitudes. When obvious L/M-contamination showed up at light offset (0.5 and 0.4), b-wave amplitudes were negated and plotted. When obvious L/M contamination showed up at light onset (0.1), b-wave amplitudes were plotted. The data points were fit, and the x intercept was taken as the fine-tuned S-isolated condition. This example would predict turning the long wavelength silencing lights down to 0.25% of their calculated isolation without a lens estimate.
