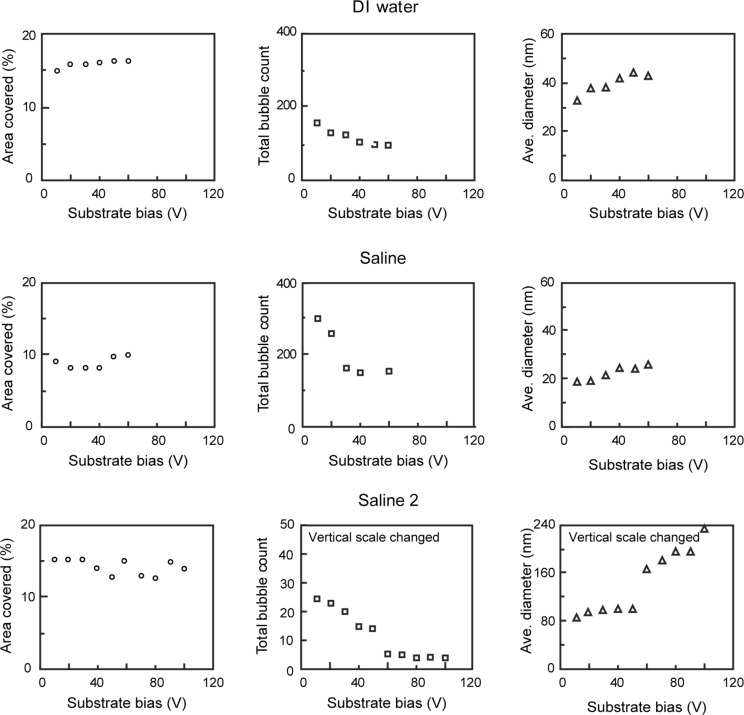
Figure 16.
Geometrical distribution of nanobubbles as a function of applied voltage on PS surface in DI water (first row), saline solution (second row) shown in Figure 13 and Figure 14, respectively, and in saline 2 (third row) shown in Figure 15. Reproduced with permission from [55]. Copyright (2013) Elsevier.

