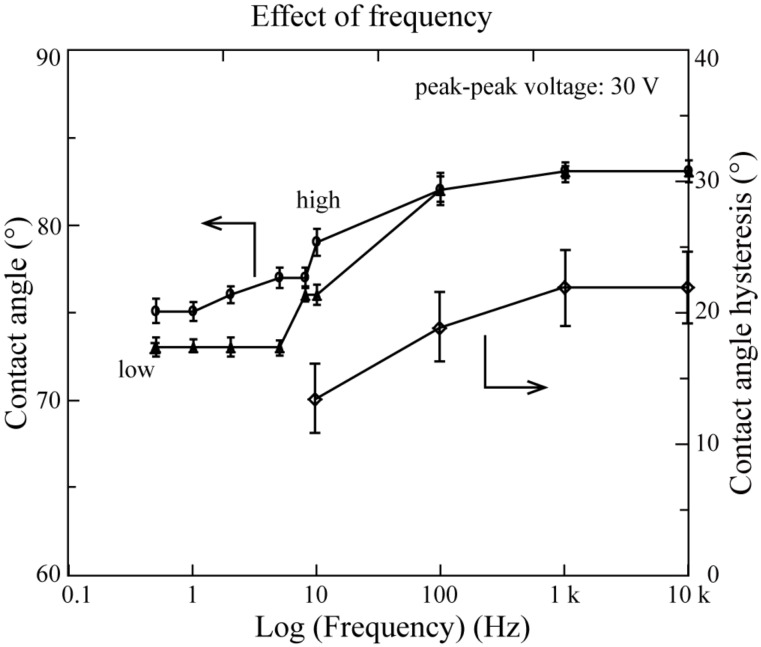
Figure 9.
The CA and CAHs of the droplet as function of the frequency of an AC voltage with a peak-to-peak value of 30 V. The frequency is in log scale. The “high” and “low” plots mean the maximum and minimum value of the CA, respectively. Reprinted with permission from [76]. Copyright (2011) American Chemical Society.

