Figure 5.
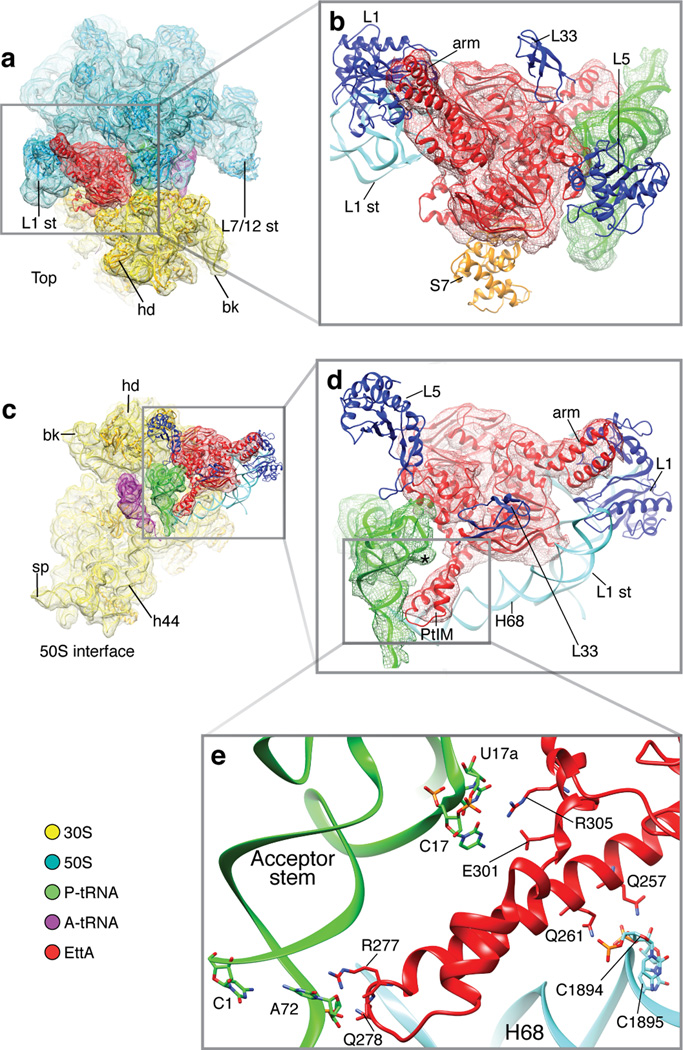
MDFF-fitted EttA-EQ2-bound PRE complex structure. (a) Top view; (b) close-up of the boxed region in (a). (c, d, e) Stepwise close-up of the boxed region in the previous panel viewing from the 50S side of the intersubunit interface. Color scheme is the same as Fig. 1. Blue and orange ribbons, ribosomal proteins of 50S and 30S subunit, respectively. Cryo-EM map is rendered as mesh contour. The starred region in (d) indicates the protrusion formed by the CpU bulge of P-site tRNAfMet. Residues involved in possible interactions between EttA and P-site tRNAfMet or 23S rRNA are represented as sticks in (e).

