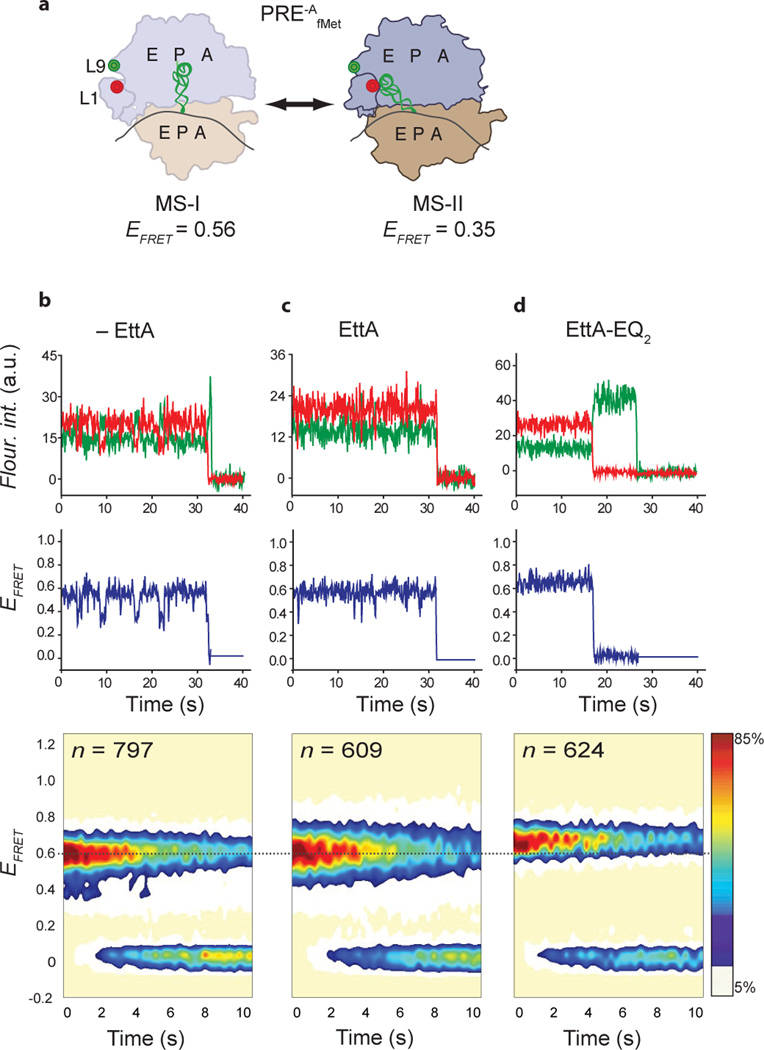
Figure 6.
EttA-mediated regulation of the open L1 stalk ↔ closed L1 stalk equilibrium of a PRE-AfMet complex as observed using smFRETL1-L9. (a) Cartoon diagram of the conformational equilibrium of the PRE-AfMet complex between the MS-I conformation harboring an open L1 stalk (ribosomal complex on left) and the MS-II conformation harboring a closed L1 stalk (ribosomal complex on right). 30S subunit, tan cartoon; 50S subunit, blue cartoon; tRNAfMet, green ribbon,; mRNA, black curve; Cy3 FRET donor fluorophore, green circle; and Cy5 FRET acceptor fluorophore, red circle. (b, c, d) smFRETL1-L9 experiments recorded in the presence of 2 mM ATP and in (b) the absence of EttA, (c) the presence of 6 µM EttA, or (d) the presence of 6 µM EttA-EQ2. 1st row: Representative Cy3 and Cy5 fluorescence intensity (Fluor. int.) vs. time trajectories. The fluorescence intensities are plotted in arbitrary units (a.u.) with the Cy3 fluorescence intensity plotted in green and the Cy5 fluorescence intensity plotted in red. 2nd row: The corresponding EFRET vs. time trajectories. The EFRET at each time point was calculated using EFRET = ICy5 / (ICy3 + ICy5), where ICy3 and ICy5 are emission intensities of Cy3 and Cy5, respectively, and is plotted in blue. 3rd row: Surface contour plots of the time evolution of the population FRET. The contour plots were generated by superimposing individual EFRET vs. time trajectories, and colored from white (lowest-populated) to red (highest-populated). n denotes the number of EFRET vs. time trajectories used to construct each contour plot.

