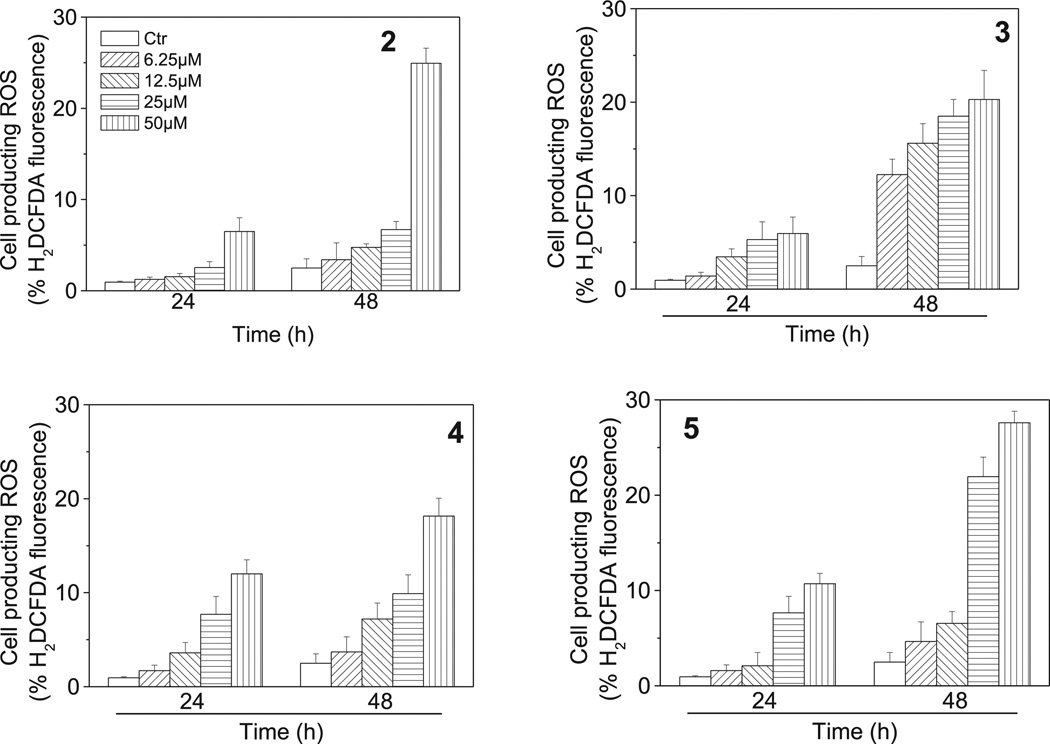
Fig. 11.
Mitochondrial production of ROS in HeLa cells following treatment with compounds 2–5. After 24 or 48 h incubations with the indicated compounds at the indicated concentration, HeLa cells were stained with H2-DCFDA and analyzed by flow cytometry. Data are expressed as mean ± SEM of three independent experiments.

