FIGURE 5.
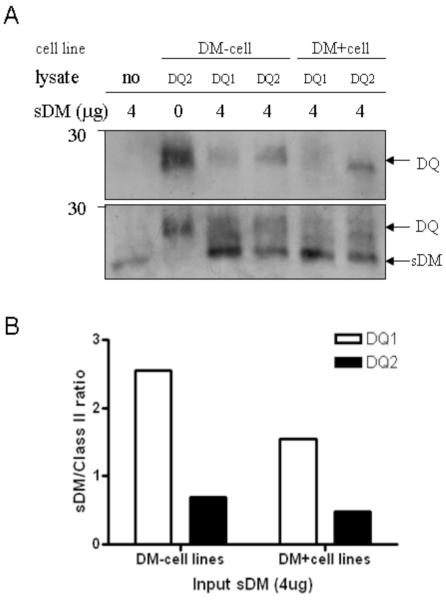
DQ2 shows reduced binding interaction with DM compared to DQ1. DQ2 and DQ1 were immunoprecipitated with SPV-L3 from DM-positive (DR-null) B-LCLs 9.22.3 (DQ2) or 3.1.3 (DQ1), and DM-null cells 9.5.3 (DQ2) and 2.2.93 (DQ1), respectively, and then incubated with soluble recombinant DM to allow molecular interaction. (A) Input class II amount was measured by immunoblotting with anti-class IIβ chain Ab XD5.A11 (top) followed by measuring the amount of interacting DM by immunoblotting with anti-DMα mAb 5C1. Shown is one representative image of at least three experiments. (B) Ratio of sDM:class II band intensity was calculated by densitometric analysis of the images in 5A: DM+ cell lines: 3.1.3 (DQ1) and 9.22.3 (DQ2) and DM-null cells: 2.2.93 (DQ1) and 9.5.3 (DQ2).

