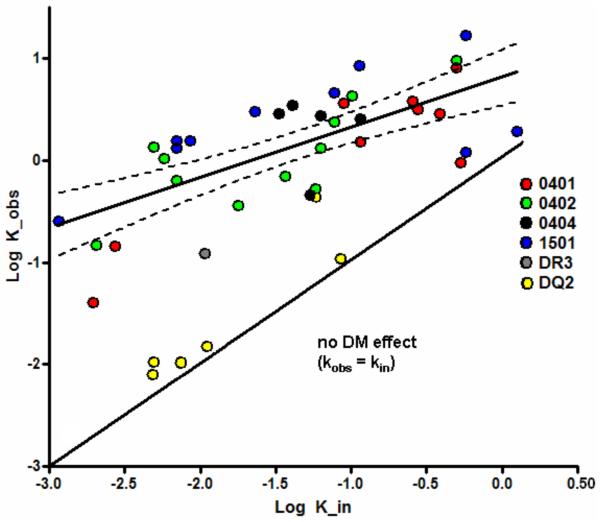
FIGURE 6.
Relationship between intrinsic and DM-catalyzed dissociation. Dissociation rate constants, k, calculated from the t½, by the equation t½ =ln2/k, are plotted on a log10 scale in units of hours−1. The x-axis shows dissociation in the absence of DM; the y-axis shows dissociation in the presence of soluble DM. The solid best-fit straight line through the data has a slope of 0.47 (95% confidence interval, 0.3–0.64; thin dashed curves). The solid line of slope 1 through the origin indicates no DM effect; the vertical distance of each data point from this line is a measure of DM susceptibility. These data have been published with the exception of the data from the DQ2 and DR3 complexes (21). In order to compare current results to previous work on 36 complexes, it was necessary to correct values for the differences in concentration of DM used; previous work indicated that effects of DM in the DM concentration range of both these assays are linear (Mellins, unpublished). An outlier DR4 complex was excluded from the original correlation analysis (21) and is not shown.

