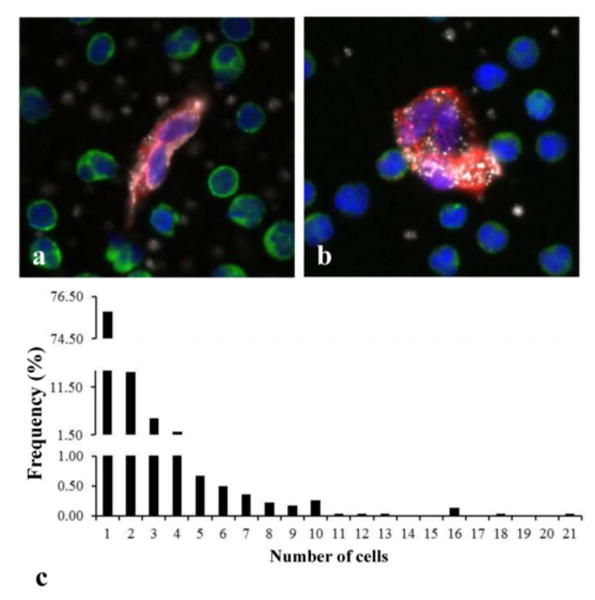
Figure 4.

CEC aggregates found in MI patients. a) and b) are representative aggregates of 2 and 3 cells, respectively, with DAPI positive nucleus (blue), no CD45 staining (green), and double positive CD146 (red) and vWF (white) staining of cytoplasm. c) Frequency histogram showing the distribution of CEC aggregates found in all MI patients. Detected CEC aggregates consisted of up to 21 CECs but aggregates containing 2–4 cells were more frequently found.
