Figure 7.

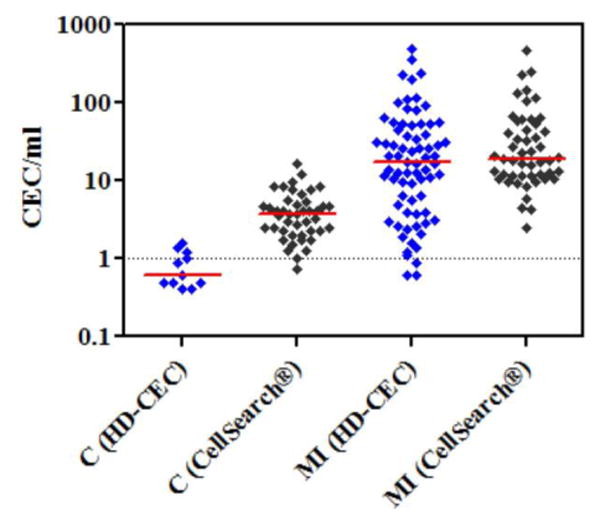
Comparison of the overlap between CEC counts in healthy controls (C) and MI patients as determined by the HD-CEC assay and the CellSearch® assay. Y-axis is in log scale and red lines represent median values.

Comparison of the overlap between CEC counts in healthy controls (C) and MI patients as determined by the HD-CEC assay and the CellSearch® assay. Y-axis is in log scale and red lines represent median values.