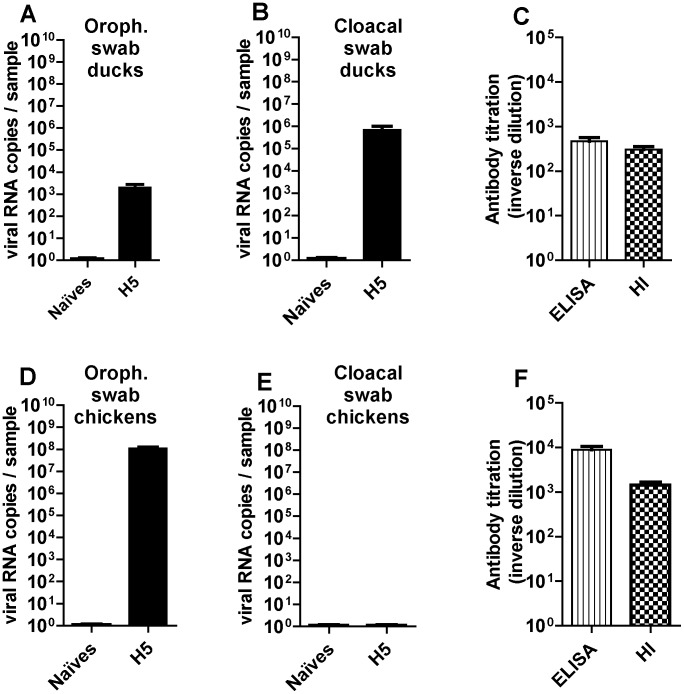
Figure 2. Viral excretion in upper airways (left) or in lower digestive tract (middle) and antibody response (right) to LPAIV H5N3 in ducks (top) or in chickens (bottom).
Viral load in oropharyngeal swabs (A, D) and cloacal swabs (B, E) was expressed as viral RNA copies per sample and compared between control (naïves) and challenged birds two days (for chickens, corresponding to the peak of infection in lung) or three days (for ducks, corresponding to the peak of infection in cloacum) after inoculation. All the swabs were eluted in 1.5 ml PBS and were analysed using strictly the same protocol for RNA extraction and RT-PCR. Antibody titration (C, F) was expressed as inverse dilution of serum used for measurement by ELISA (vertical scores) or haemagglutination inhibition method (HI, draught-board).

