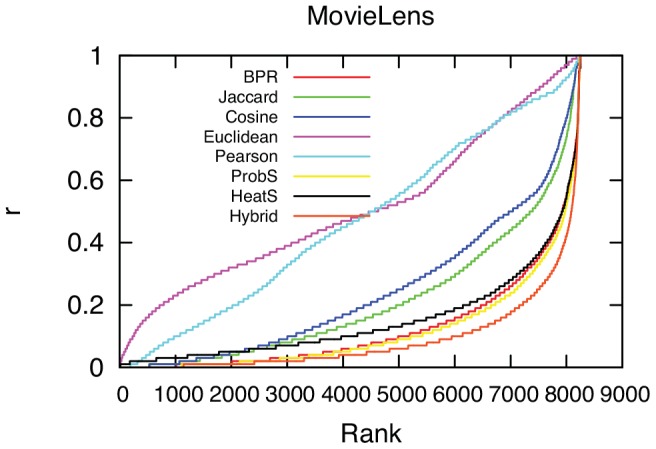
Figure 2. The predicted position of each entry in the probe ranked in the ascending order.

On the y-axis,  measures the position of an
  edge (
 ) in the ordered result of the prediction. For example, if there are 1500 uncollected
  connections for
  , and
, and  is the 30th strongest prediction, we say the position of
  is the top 30/1500, denoted by
  . Lower
  values indicate better predictions.
