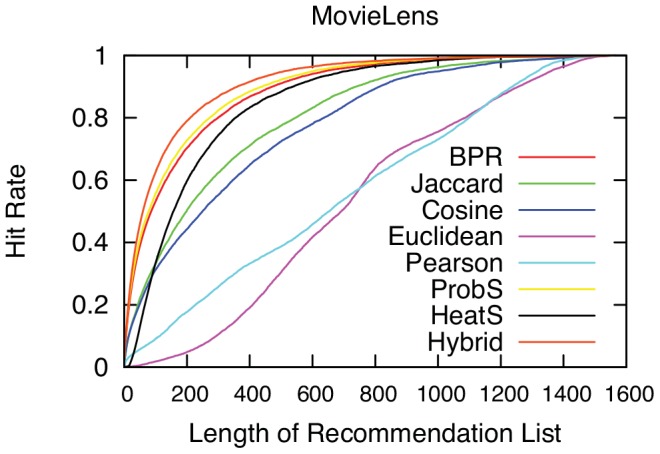
Figure 3. The hitting rate as a function of the length of recommendation list.

We shorten the recommendation list to increasing values, in the x-axis, and we report the share of actual  edges predicted, on the y-axis. The higher the hit rate, the better the prediction.
