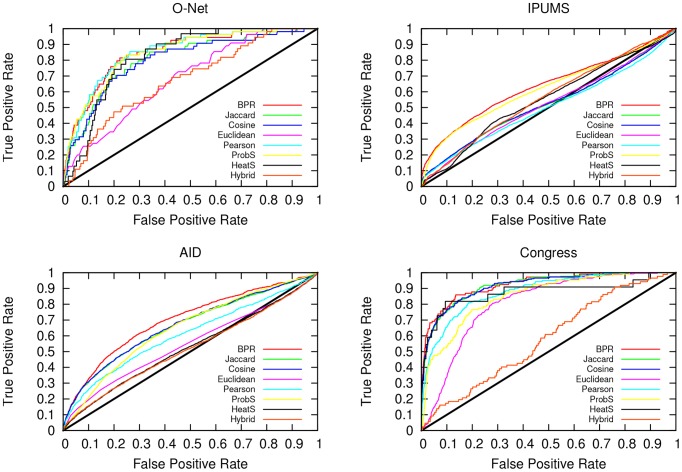
Figure 4. ROC Curves.
The receiver operating characteristic (ROC) curves for the four datasets in our experimental set up: O-Net (top left), IPUMS (top right), Aid (bottom left) and Congress (bottom right). Each predicted  edge is sorted according to the prediction confidence and it is tested against the observed real-world graph.

