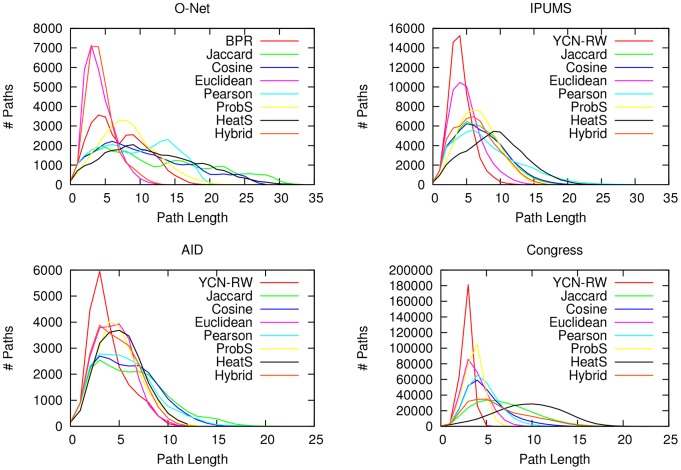
Figure 5. Path distributions.
The distribution of the shortest paths in the unipartite graphs generated with each technique, for all datasets: O-Net (top left), IPUMS (top right), Aid (bottom left) and Congress (bottom right). We count the number of paths (y-axis) with a given length in number of edges (x-axis).

