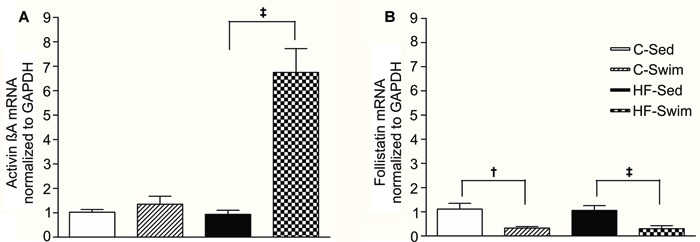
Figure 3. Liver expression mRNA. A, Activin βA and B, follistatin mRNA expression in liver of Wistar rats. Data are reported as means±SE for n=6-7 rats/group. †P<0.05, sedentary control group (C-Sed) vs exercised control group (C-Swim); ‡P<0.05, sedentary high-fat diet group (HF-Sed) vs exercised high-fat diet group (HF-Swim) (t-test).