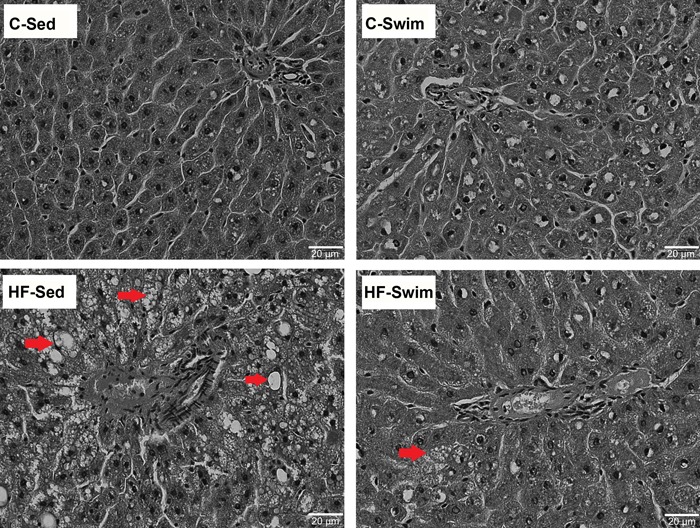
Figure 4. Histological analysis of liver from rats fed standard rodent chow and a high-fat diet. Representative microphotographs of hematoxylin-eosin-stained sections (bar=20 µm) are shown. Red arrows indicate fat accumulation. C-Sed: sedentary control group; C-Swim: exercised control group; HF-Sed: sedentary high-fat diet group; HF-Swim: exercised high-fat diet group.