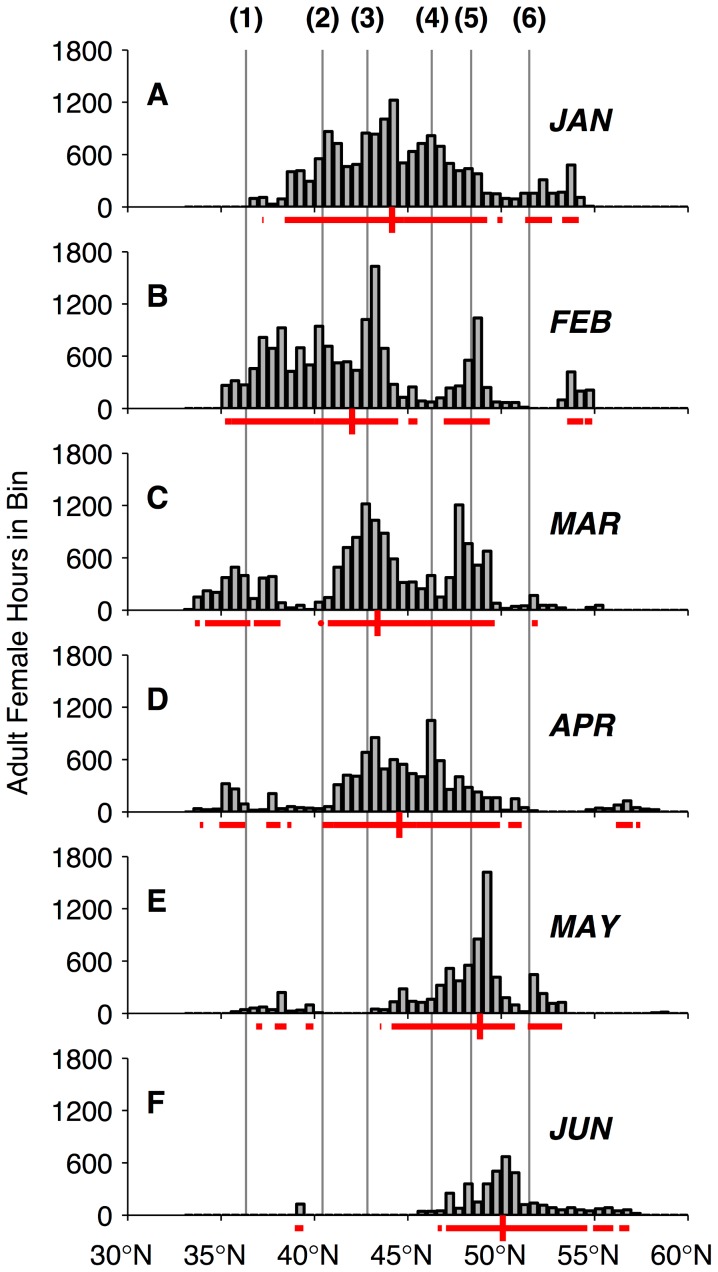
Figure 5. Monthly evolution of adult female northern fur seal alongshore distribution.
January (A) through June (F). Gray bars in each plot are a histogram of time spent in that month in 0.5° latitude bins within the California Current and Gulf of Alaska Large Marine Ecosystems east of 145°W, during the winters 2002–03 to 2009–10. Red horizontal lines below A–F indicate the latitudes in which 95% of time spent occurred in that month. Vertical red lines indicate median latitude of the alongshore distribution. Vertical gray lines extending through panels A–F correspond to the latitudes of prominent coastal features, illustrated in Figure 3, which are also numbered above panel A in this figure as follows: (1) Point Sur; (2) Cape Mendocino; (3) Cape Blanco; (4) Columbia River; (5) Strait of Juan de Fuca mouth; (6) Queen Charlotte Sound.

