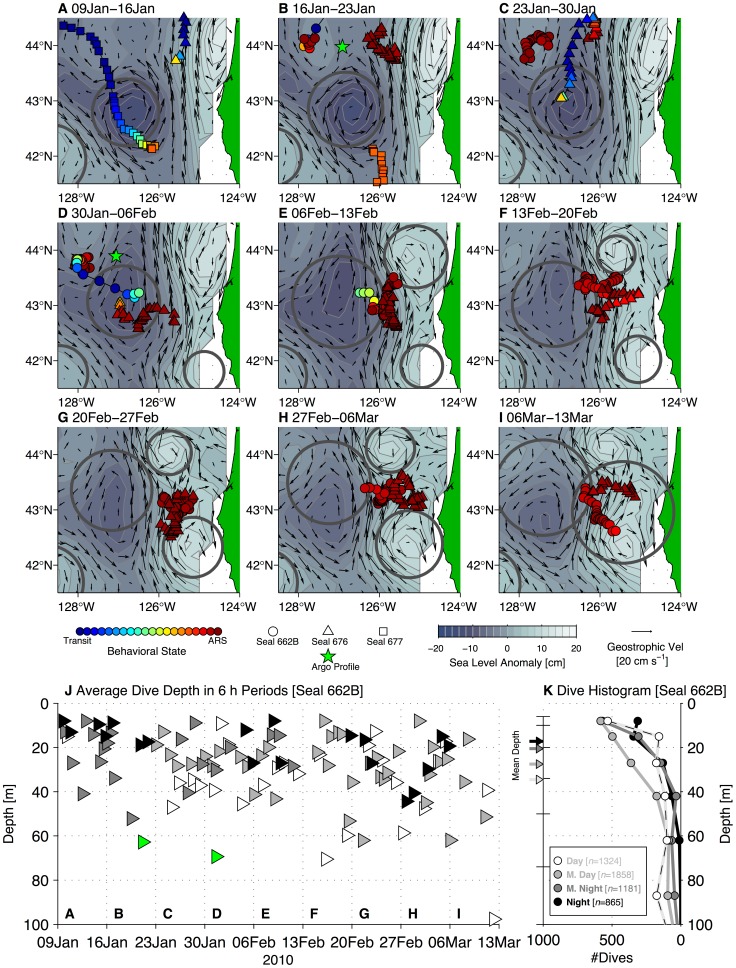
Figure 12. Winter surface circulation at Cape Blanco in 2010 and habitat utilization by three adult female northern fur seals.
(A)–(I) Weekly intervals of sea level anomaly (color contours, scale below panel H), surface geostrophic velocity anomaly (Vel, black arrows, scale below panel I), and estimated locations of three satellite-tagged adult females (colored by estimated behavioral state, scale below panel G, ARS = area-restricted search) in the Cape Blanco region in 2010. Symbol types for each individual are also shown below panels G–H. As in Figure 11, thick gray circles indicate the locations and approximate spatial extent of altimetry-identified mesoscale eddies from Chelton et al. [63]. In panels B and D, green stars show the location of two Argo float profiles collected during these time periods. (J) Mixed-layer depth calculated from Argo profiles (green triangles), along with average dive depth in 6 h periods from female seal 662B track. Each 6 h period is sorted into one of four categories based on its proportion daylight (black triangles = night, dark gray = mostly night, light gray = mostly day, white = day, as defined in Results section Links to Mesoscale Circulation and Coastal Topography). (K) Histograms, one for each proportion daylight category, showing number of dives in that category that have maximum depth within each dive tag pre-programmed depth bin. Depth bin bounds are indicated on the left y-axis by whiskers. Arrows at left of panel K indicate average dive depth by proportion daylight category. Symbol shading follows that of panel J.

