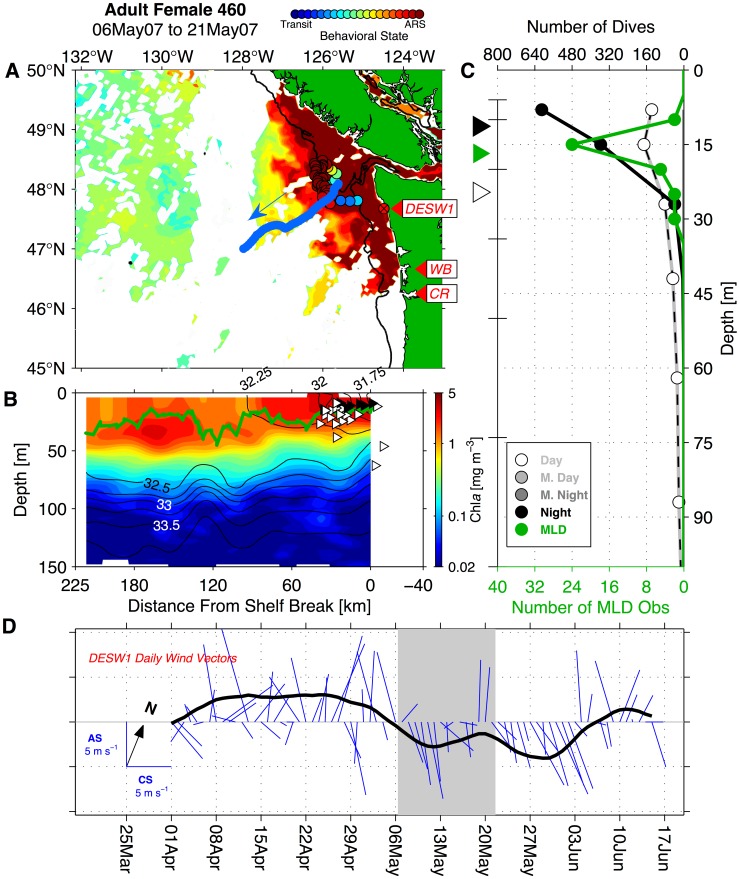
Figure 18. Adult female northern fur seal 460 in area-restricted search off the Washington coast, continued: 06 May to 21 May 2007 (3 of 4).
(A) Estimated locations of female 460 (filled color circles) and reported GPS locations of Seaglider 014 (SG014, thick blue line) off the Washington and British Columbia coast (green). Red labels indicate the Columbia River mouth (CR), Willapa Bay coastal inlet feature (WB), and the location of National Data Buoy Center station Destruction Island (DESW1, red cross-circle at station). Colors of filled circles indicate behavioral state (scale at top, ARS = area-restricted search). The 200 m isobath is indicated by thin black line. Arrow indicates direction of travel of SG014. Background colors in panel A indicate surface chlorophyll-a (Chla) in cloud-free regions on 11 May, plotted on the same scale as in panel B. (B) Upper-ocean conditions by depth and distance from the shelf break recorded by SG014 during its crossing: Chla (background colors), salinity (black contours), and mixed-layer depth (MLD, dark green line). Triangles indicate average depths of female northern fur seal 460's dives in each 6 h period. Triangles are plotted by cross-shore distance along the Seaglider line, and triangle fill colors indicate proportion daylight category of each 6 h period (black triangles = night, dark gray = mostly night, light gray = mostly day, white = day, as defined in Results section Links to Mesoscale Circulation and Coastal Topography). (C) Histograms of seal 460's diving, one for each proportion daylight category, showing number of dives within each dive tag pre-programmed depth bin. Depth bin bounds are indicated on the left y-axis by whiskers. Green line in panel C is a histogram of MLD observations collected between 0 and 60 km from the shelf break using 5 m depth bins. Filled triangles to the left of Panel C indicate the average dive depth in each category of proportion daylight and the average MLD. (D) Daily-averaged wind vectors at 52.7 m height obtained from DESW1. Wind measurements at DESW1 have been rotated into an alongshore (AS)/cross-shore (CS) coordinate system. In panel D, the solid black line is a 10 d running average of the poleward component of wind. Gray shading indicates the time period covered by A–C.

