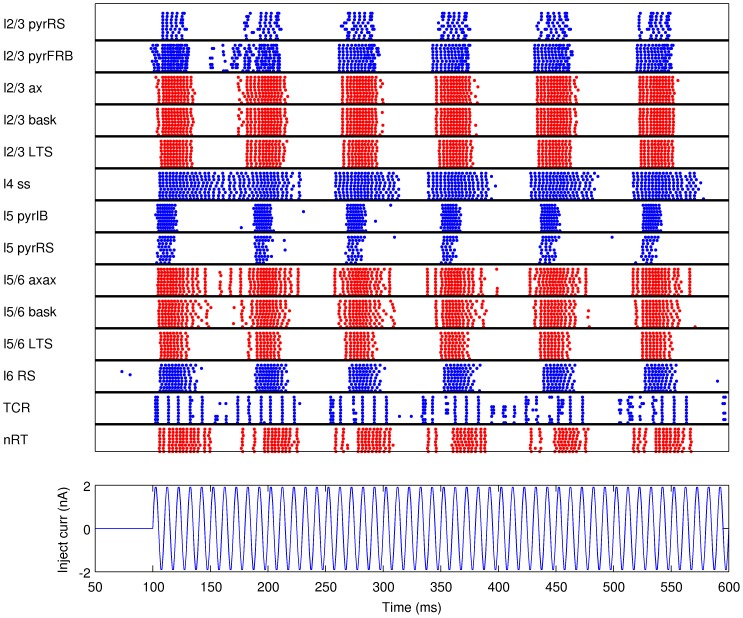
Figure 3. Raster plot of the network activity for the simulation of the response to injection of oscillatory current (100 Hz) to the thalamus.
Blue dots indicate spikes of excitatory neurons, red dots indicate spikes of inhibitory cells. For clarity of the picture, only activity of ten cells from a given population is shown (activity of all cells within populations was similar).

