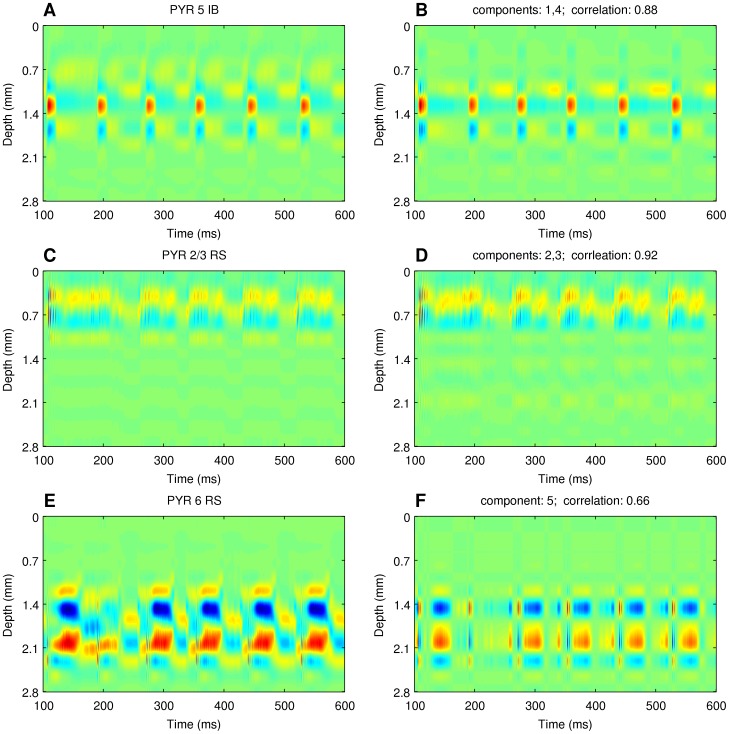
Figure 7. Recovering activity of population from independent components.
Comparison of the spatiotemporal profiles of the activity of the three populations dominating the CSD with the profiles of summed independent components for the case of Figure 6. Note that the color scale on the figures has been set the same for every row and is selected to emphasize each activity.

