
Figure 3. Moduli of the Fourier transform of experimental (dots) and best fit (full line) k-weighted Fe-K edge EXAFS spectra of all the investigated samples (vertically shifted for sake of clarity).
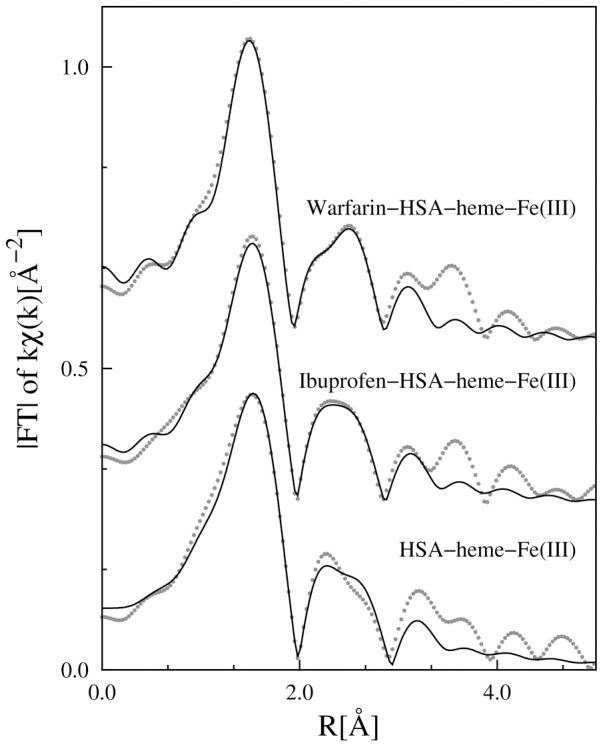
The FT are prone to simple qualitative interpretation of the local structure around the absorber as the peaks denote a coordination shell. However, the phase shift function (Eq. 1) reduces the peak position by roughly 0.5 Å with respect to the real value.