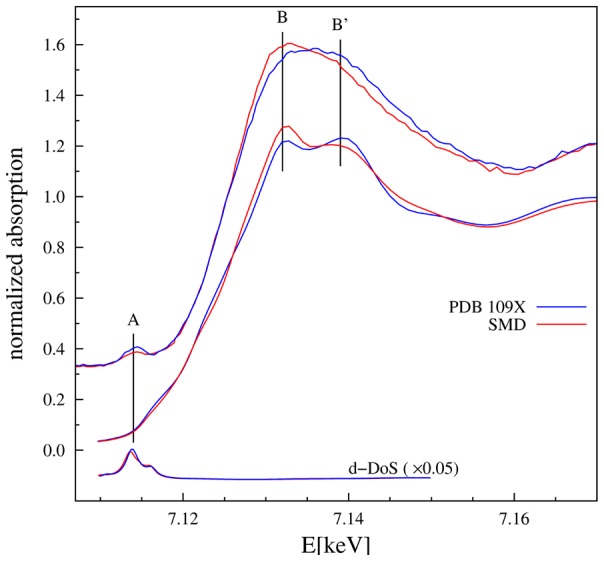
Figure 6. Top curves represent the experimental XANES spectra of HSA-heme-Fe(III) (blue) and warfarin-HSA-heme-Fe(III) (red).

Middle curves are the XANES spectra calculated ab initio using the FEFF code [32] for atomic cluster made combining SMDS and EXAFS results. The bottom curves represent the density of d states (d-DoS). The calculated XANES spectra reproduce the main experimental features, in particular the inversion of B and B′ peaks upon drug binding is reproduced. The pre-edge peak A corresponds to the d-DoS.
