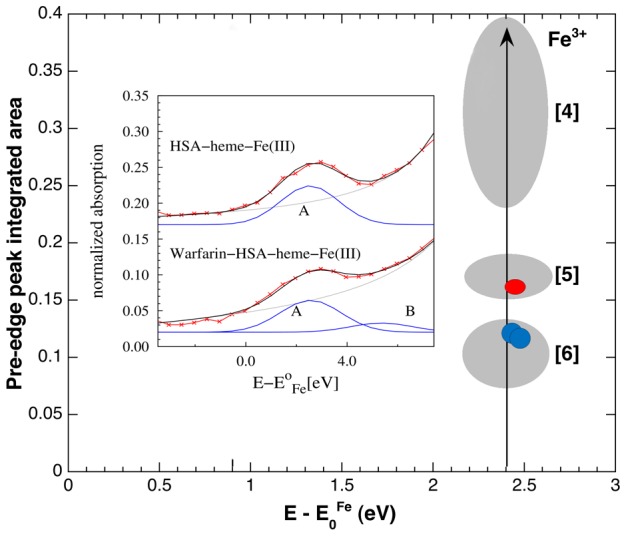
Figure 7. Semi-quantitative analysis of Fe(III) pre-edge peaks and comparison with reference compounds.

In the inset, the experimental Fe(III) pre-edge peak (red symbols) of HSA-heme-Fe(III) and warfarin-HSA-heme-Fe(III) are modelled combining an arctangent function (gray line), simulating the onset of the continuous electron states, and Gaussian peaks (blue lines), representing the transitions to localized electronic states. The grey ellipses enclose the values of Fe(III) pre-edge peak integrated areas versus their centroid positions, measured on tetra-, penta-, and hexa- coordinated Fe(III) reference compounds (labelled [4], [5], and [6], respectively; [56]). The pre-edge peak parameters of HSA-heme-Fe(III) (red circle) fall in the region of penta-coordinated Fe(III), while ibuprofen-HSA-heme-Fe(III) and warfarin-HSA-heme-Fe(III) pre-edge peaks parameters (blue circles) are in the region corresponding to hexa-coordinated Fe(III) compounds. The pre-edge fitting of drug-bound HSA-heme-Fe(III) samples requires an additional peak (labelled B) in the region about 2 eV above the main one (labelled A). Analogous components have been reported in ref. [54]. The size of red and blue symbols takes into account for best fit incertitude.
