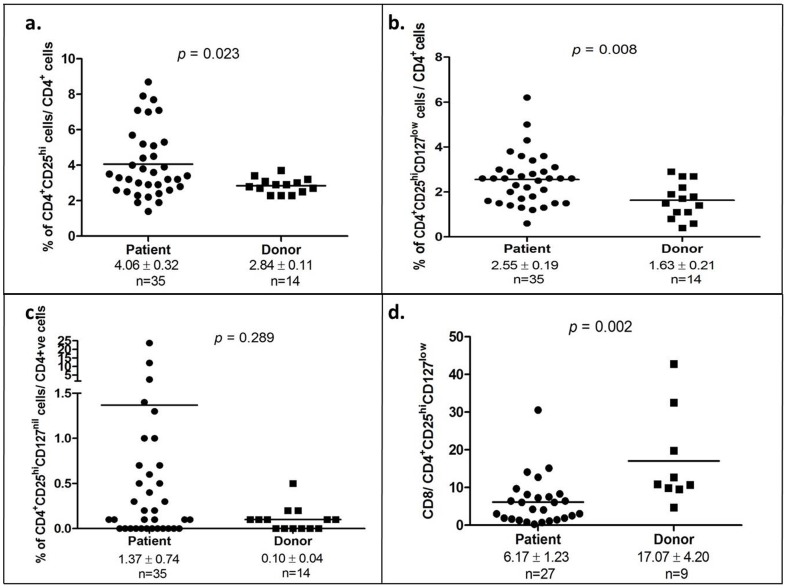
Figure 3. CD4+CD25hiCD127low regulatory T cells were up-regulated in OSCC patients.
(a) Percentage of CD4+CD25hi T cells amongst CD4+T cells in OSCC patients and healthy donors; (b) Percentage of CD4+CD25hiCD127low T cells amongst CD4+ T cells in OSCC patients and healthy donors; (c) Percentage of CD4+CD25hi CD127nil T cells amongst CD4+ T cells in OSCC patients and healthy donors; (d) Ratio of CD8 T cells/CD4+CD25hiCD127low T cells in OSCC patients and healthy donors; Each symbol represents an individual person and the narrow bar represents the mean percentage of the specific cell population.

