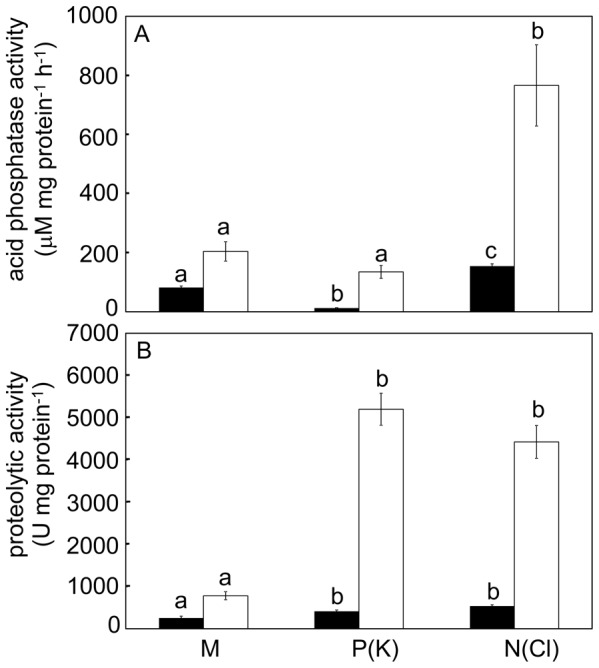
Figure 4. Enzymatic activities in response to mechanical and chemical stimulation after 24 (black bars) and 48 hours (white bars).

Acid phosphatase activity (A) and proteolytic activity (B). Different letters denote significant differences at the same time interval at P < 0.05 (ANOVA, Tukey-test), means ± s.e., n = 7–9.
