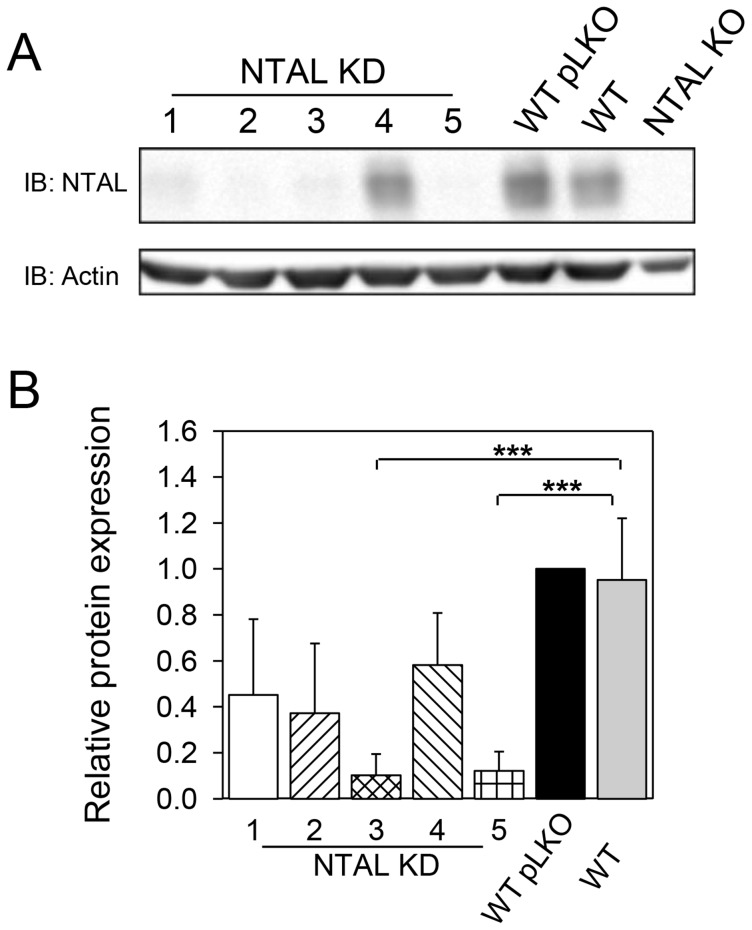
Figure 1. Decreased NTAL expression after shRNA silencing.
(A) BMMCs were infected with five lentiviral shRNA constructs (NTAL KD 1–5) or empty pLKO.1 construct (WT pLKO). After selection in puromycin, the amount of NTAL was assessed by immunoblotting. For comparison, NTAL in noninfected WT and NTAL KO cells was also evaluated. Actin was used as a loading control. (B) Densitometry analysis of NTAL immunoblots. The data were normalized to the amount of NTAL in WT pLKO cells and that of actin. Means ± SD were calculated from 3–7 independent experiments. ***p<0.001.

