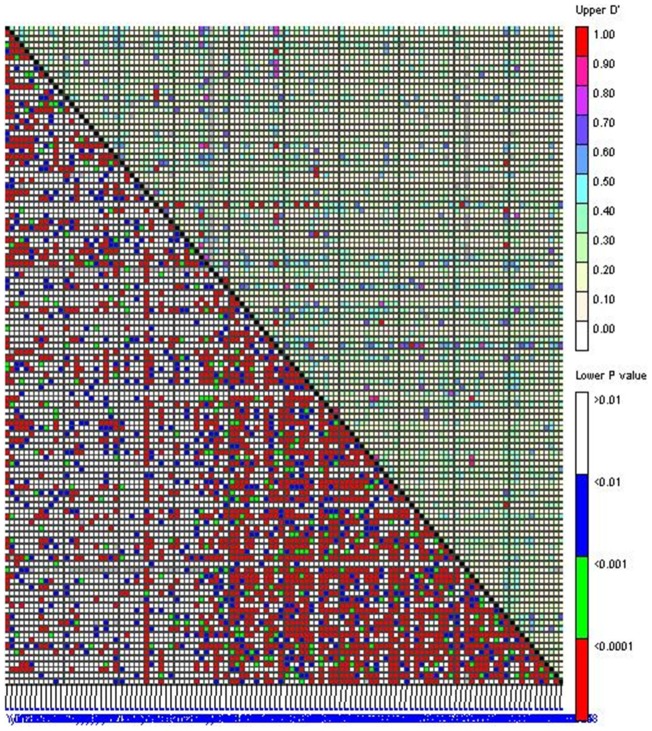
Figure 1. Disequilibrium matrix of 112 SSR polymorphic sites with both the X-axis and Y-axis.
The matrix is divided into two regions by the diagonal line. The upper right region indicates the D′ value of each SSR couples, and the corresponding blocks in the lower left region indicates the significance of D′. Various value intervals of the D′ or P values are shown in different colors according to the right color columns.

