
Fig. 1.
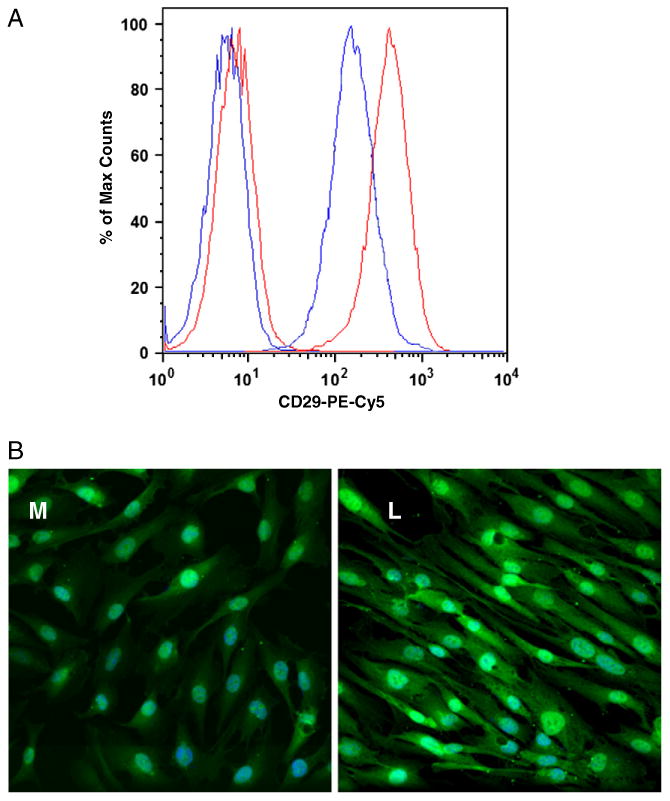
A. Representative (n=30 K) overlaid single-parameter histogram of flow cytometric analysis of the integrin β1subunit demonstrated a higher expression in leiomyoma cells (red) as compared to myometrial cells (blue). The first two peaks are the IgG isotype controls conjugated to PE-Cy5. B. Increased green fluorescence (Alexa 488) in leiomyoma cells (L) is representative of increased integrin β1subunit as compared to myometrial cells (M). Magnification=40×; experiment was repeated 4 times.