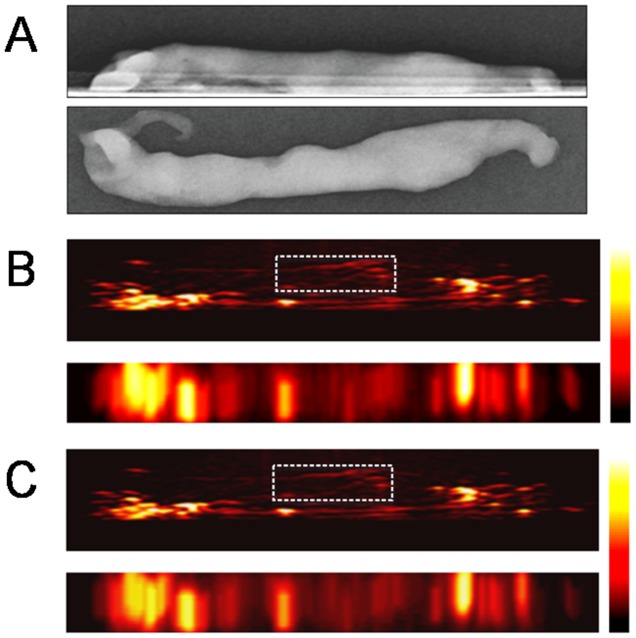
Figure 3. Representative case from ex vivo experiments with core specimens of breast tissue included in the control group (case #5).
Specimen mammography (A) and photoacoustic images (B, C) were reconstructed with comparable configurations in both directions (top-down and lateral views). The photoacoustic image at 800 nm (C) shows constant photoacoustic signal intensities from an unidentified target compared with the photoacoustic image at 700 nm (B). The signal foci in the region of interest are assumed to be in the core. All these foci show constant photoacoustic intensities. The mean value of PAI ratio† from region of interest within this core was 1.21. The other bright signal foci around the core may be photoacoustic signals from the interfaces between the surfaces of specimen and the gel pad, which show grossly constant photoacoustic signal intensities. Abbreviations: PAI ratio, calculated ratio of the amplitude occurring at the 700 nm wavelength section to that occurring at the 800 nm wavelength section.

