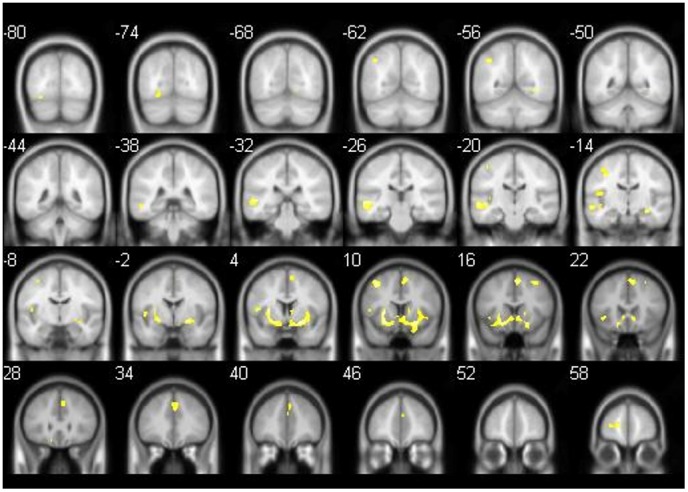
Figure 1. GM loss in MCI converters in comparison to MCI non-converters.

T1 Results of comparison of MCI converters and MCI non-converters by using an independent t-test (covariate age, significant clusters: k≥100 voxels/p<0.001 uncorr., threshold 0.1, 6 mm slices). Areas which showed more GM atrophy in MCI converters are superimposed. MCI converters show more GM loss of the frontal lobe bilaterally, the left parietal and temporal lobe, the left putamen, the left insula and the right parahippocampal gyrus.
