
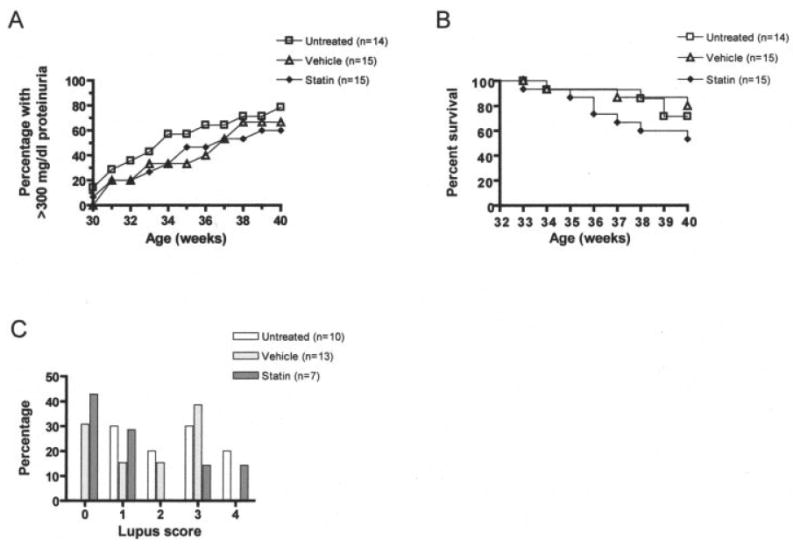
Figure 1.
Proteinuria, survival, and lupus scores in female (NZB × NZW)F1 (NZB/NZW) mice treated with atorvastatin, untreated mice, and vehicle-treated mice. A, Proteinuria data, expressed as the percentage of mice with severe proteinuria (≥300 mg/dl) as a function of age. B, Survival data, displayed in Kaplan-Meier curve form. C, Pathologic changes in renal tissue. Periodic acid–Schiff-stained tissue sections were scored on a semiquantitative scale from 0 to 4, where 0 = no glomeruli involved, 1 = up to 25% of the glomeruli involved, 2 = 25–50% of the glomeruli involved, 3 = 51–75% of the glomeruli involved, and 4 = >75% of the glomeruli involved.