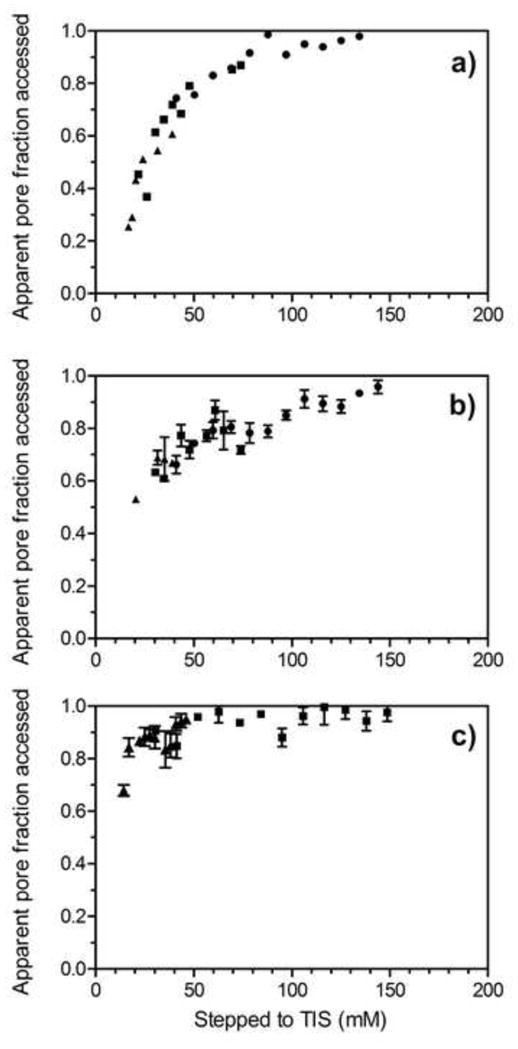
Figure 11.

Salt exclusion in Q HyperCel (a) and STAR AX HyperCel (b, c). Solution conditions for (a) and (b) were 50 mM bis-tris, pH 7, with TIS adjusted with NaCl. Symbols denote maximum TIS of buffer used for each range of ionic strengths: 200 (●), 100 (■), and 50 (▲) mM TIS. Solution conditions for (c) were 10–100 mM sodium phosphate, pH 7. Symbols denote the maximum concentration of sodium phosphate used for each range of ionic strengths: 100 (■) and 30 (▲) mM sodium phosphate.
