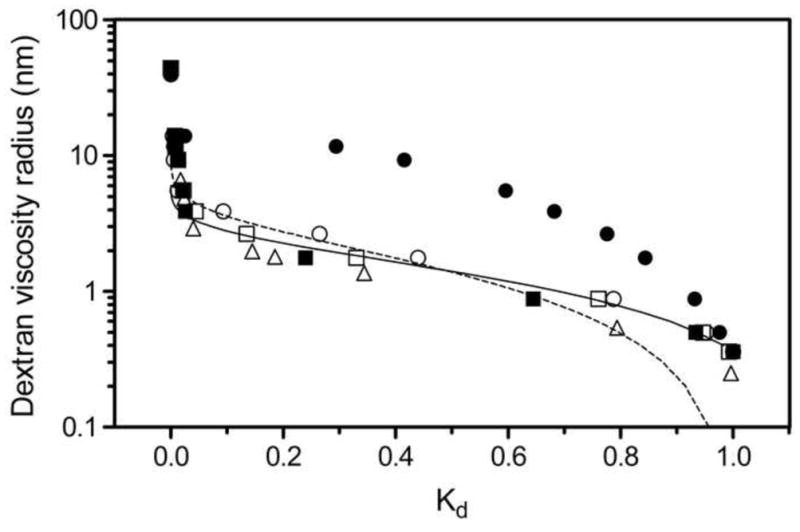
Figure 3.

Dextran calibration curves for S HyperCel (■), STAR AX HyperCel (□), Q Sepharose FF (●), and Q Sepharose XL (○); PEG calibration curve for STAR AX HyperCel (△) also shown; log-normal (---) and Ogston (—) models applied to the dextran calibration curve for STAR AX HyperCel (100 mM NaCl, pH 7).
