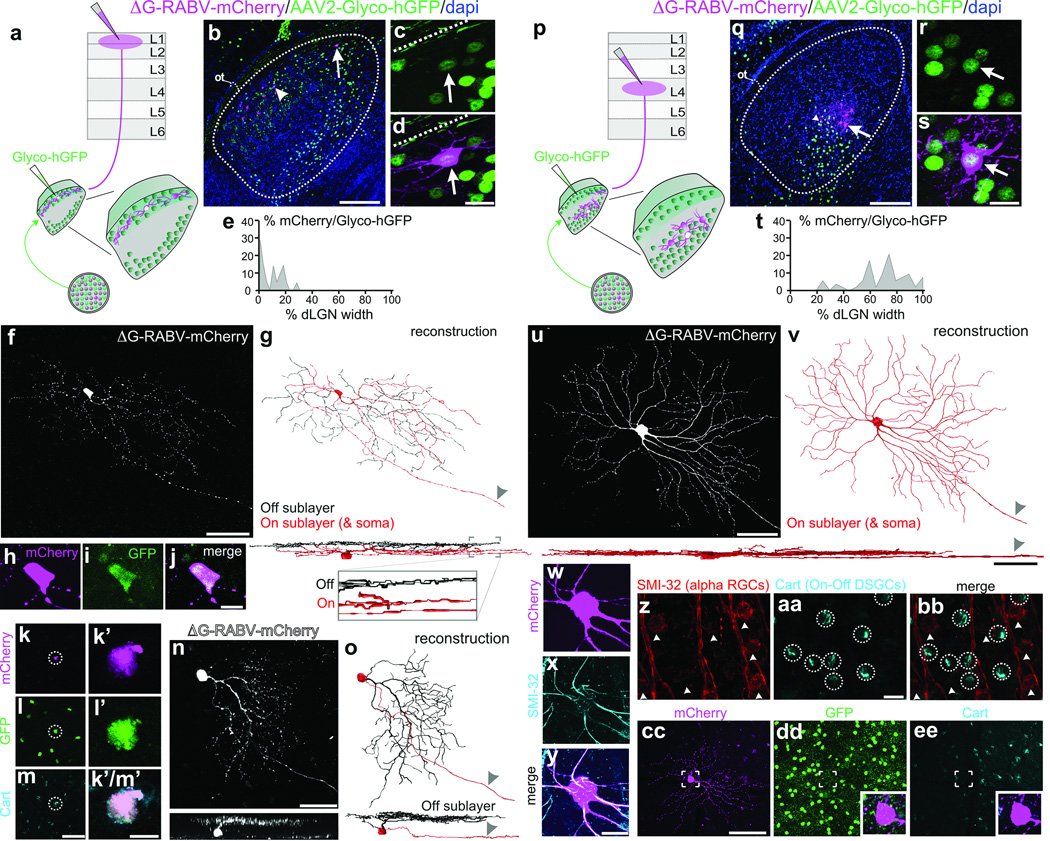
Figure 4. Synaptic circuit linking DSGCs to superficial V1, and non-DSGCs to L4.
a, Trans-synaptic tracing. b, Infected dLGN neurons. Arrow, arrowhead: double-infected cells. Scale, 100 µm. c,d, Cell from b. Scale, 15 µm. Dashed line: lateral border. e, Distribution of double-infected dLGN cells = 9.29 ± 1.82% (8 mice, n= 21 cells). f, On-Off DSGC trans-synaptically labeled from superficial V1. g, On (red) and Off (black) dendrites. Arrowhead: axon. Scale, 50 µm. h–j, Cell (f) is GFP+ On-Off DSGC6. Scale, 10 µm. k–m’, Trans-synaptically labeled GFP+ and Cart+ DSGC5m, Scale, 75 µm. m’, 10 µm. n, Trans-synaptically labeled J-RGC4o, Off dendrites (black). Scale, 50 µm. p, Same as a, but layer 4 injection. q–s, Infected neurons in core; q, arrow, arrowhead: double-infected cells. Scale, 100 µm. r,s, Cell from q (arrow). s, Scale, 15 µm. t, Distribution of double-infected dLGN cells= 70 ± 2.65% (7 mice, n= 53 cells) (P< 0.0001 versus e; two-tailed t-test). u,v, Alpha RGC labeled from V1 layer 4. u, Scale, 100 µm; sideview, 50 µm. w–y, cell (u,v), SMI-32+. Scale, 20 µm. z–bb, SMI-32 and Cart. Scale, 25 µm. cc–ee, ΔG-RABV-mCherry+ alpha RGC; lacks GFP6 and Cart. Scale, 150 µm.

