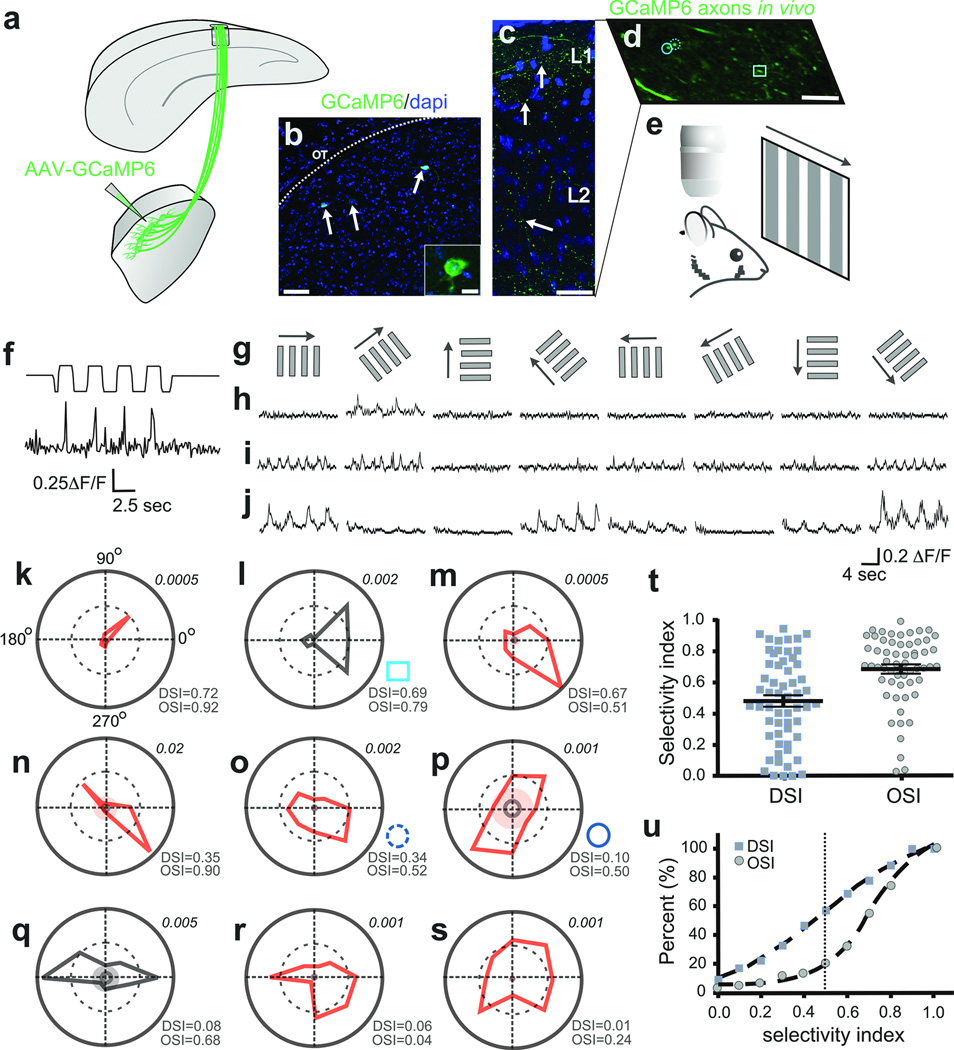
Figure 5. In vivo imaging of visually-evoked Ca++ signals in thalamocortical axons.
a, AAV2-GCaMP6 injection to dLGN shell b, GCaMP6+ neurons (arrows). Scale, 50 µm; inset, 10 µm. c, GCaMP6+ dLGN axons, superficial V1. Arrows: varicosities. Scale, 50 µm. d, GCaMP6+ axons, superficial V1. Circles, square: polar plots l,o,p. Scale, 5 µm, e, In vivo imaging/visual stimulation. f, Visually-evoked Ca++ signal in thalamocortical axon (top trace: photodiode signal; bottom trace: ΔF/F. g, Directional stimuli (0°, 45°, 90°, 135°, 180°, 225°, 270°, 315°). h–j, Direction- (h,i) and orientation-tuned (j) varicosities. 5–8 trial average. k–s, Polar plots of F1 (red) or F2 (black) magnitude responses (Methods). Inner solid ring: average response to mean grey stimulus. Shaded: 3 standard deviations greater than the mean response to grey stimuli. Lower right of each plot: OSI/DSI . Upper right: Fourier amplitudes. t, DSI/OSI, all varicosities (5 mice, n= 58 varicosities). Mean ± s.e.m. u, Cumulative distributions: OSI (circles), DSI (squares).

