
Extended Data Figure 2. Approach for assessing laminar specificity of mouse geniculocortical projections.
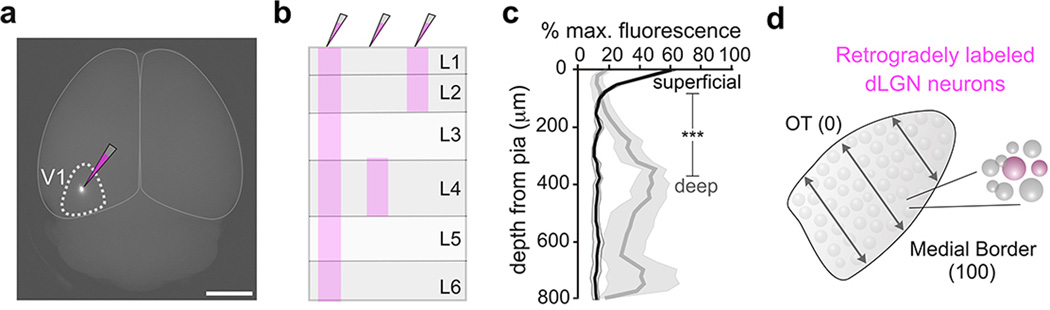
a, Focal retrograde tracer injection to V1. Scale, 3 mm. b, Diagram of the three different injection depths used to generate data in Fig. 2. c, Percentage of fluorescence in V1 from superficial (black line) versus deep (gray line) injections. Superficial: peak intensity occurs at 25 μm from pial surface (4 mice). Deep: peak intensity occurs at 350 μm from pial surface. Gray shaded regions: s.e.m. (superficial vs. deep= ***P < 0.0001; two-way ANOVA). d, Assessment of retrogradely labeled cells across the width of the dLGN. 0% is at optic tract, 100% is at medial border (see Fig. 2g–i).